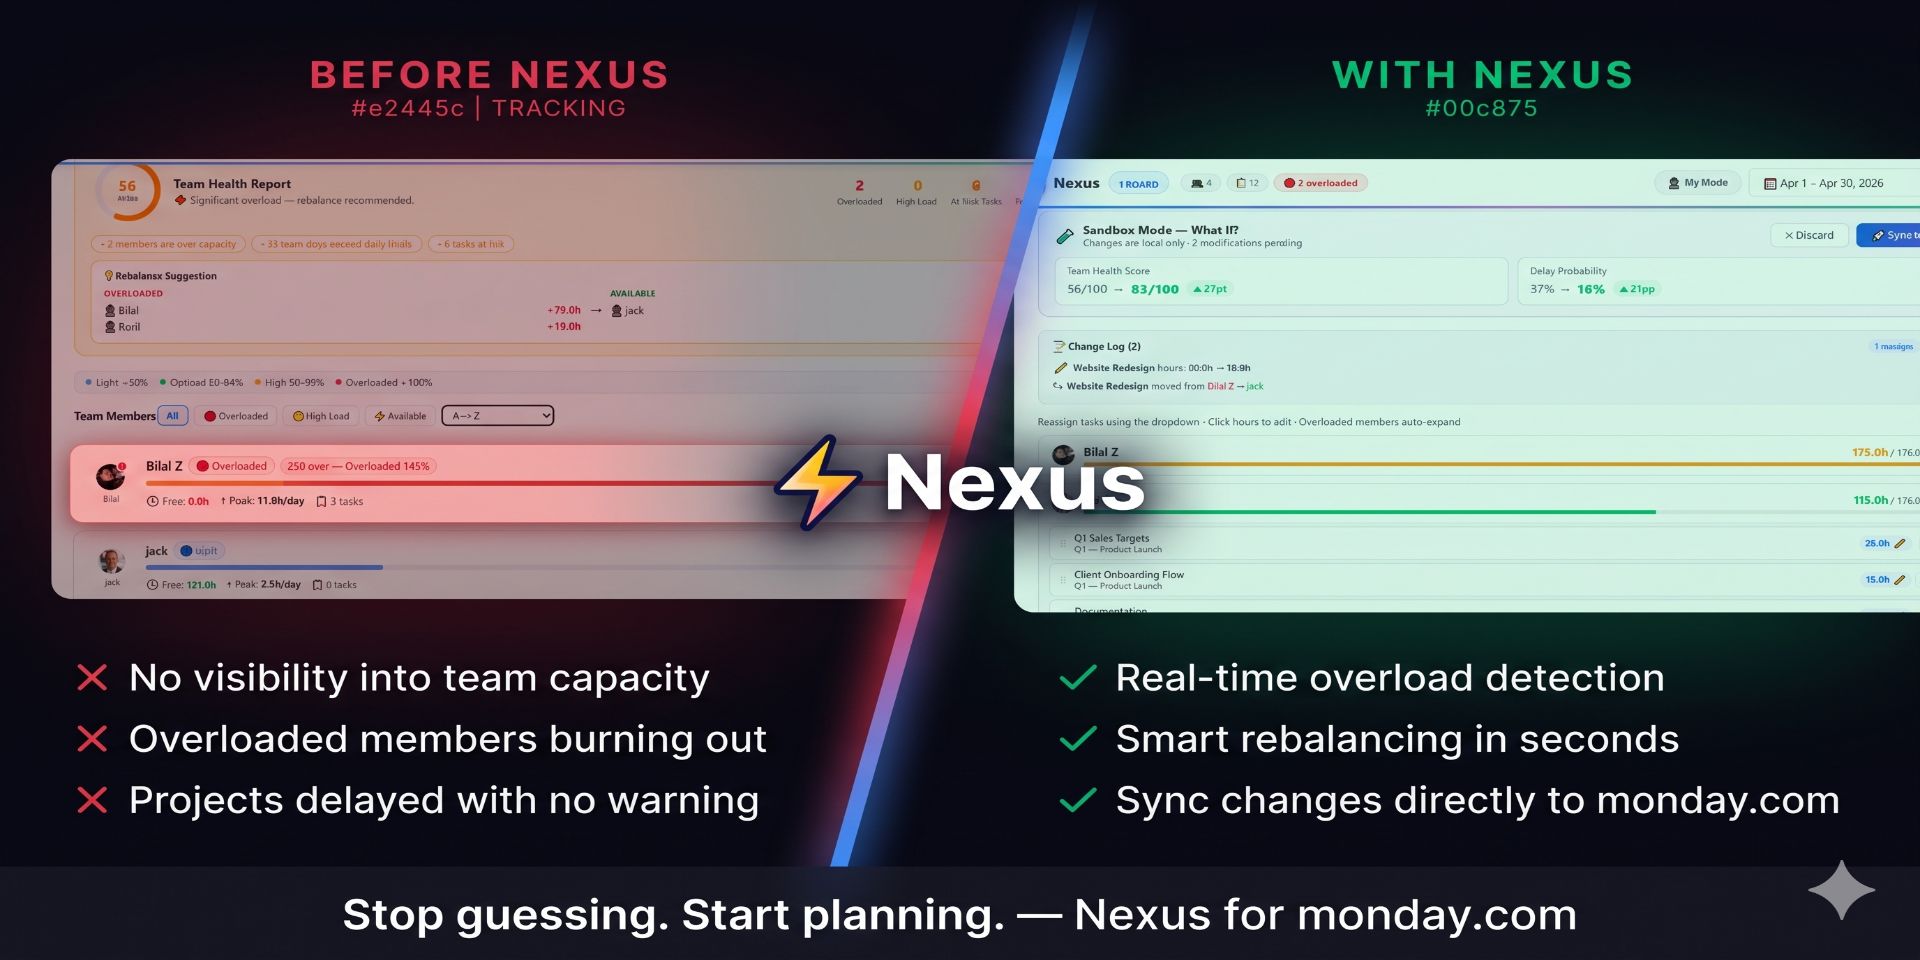
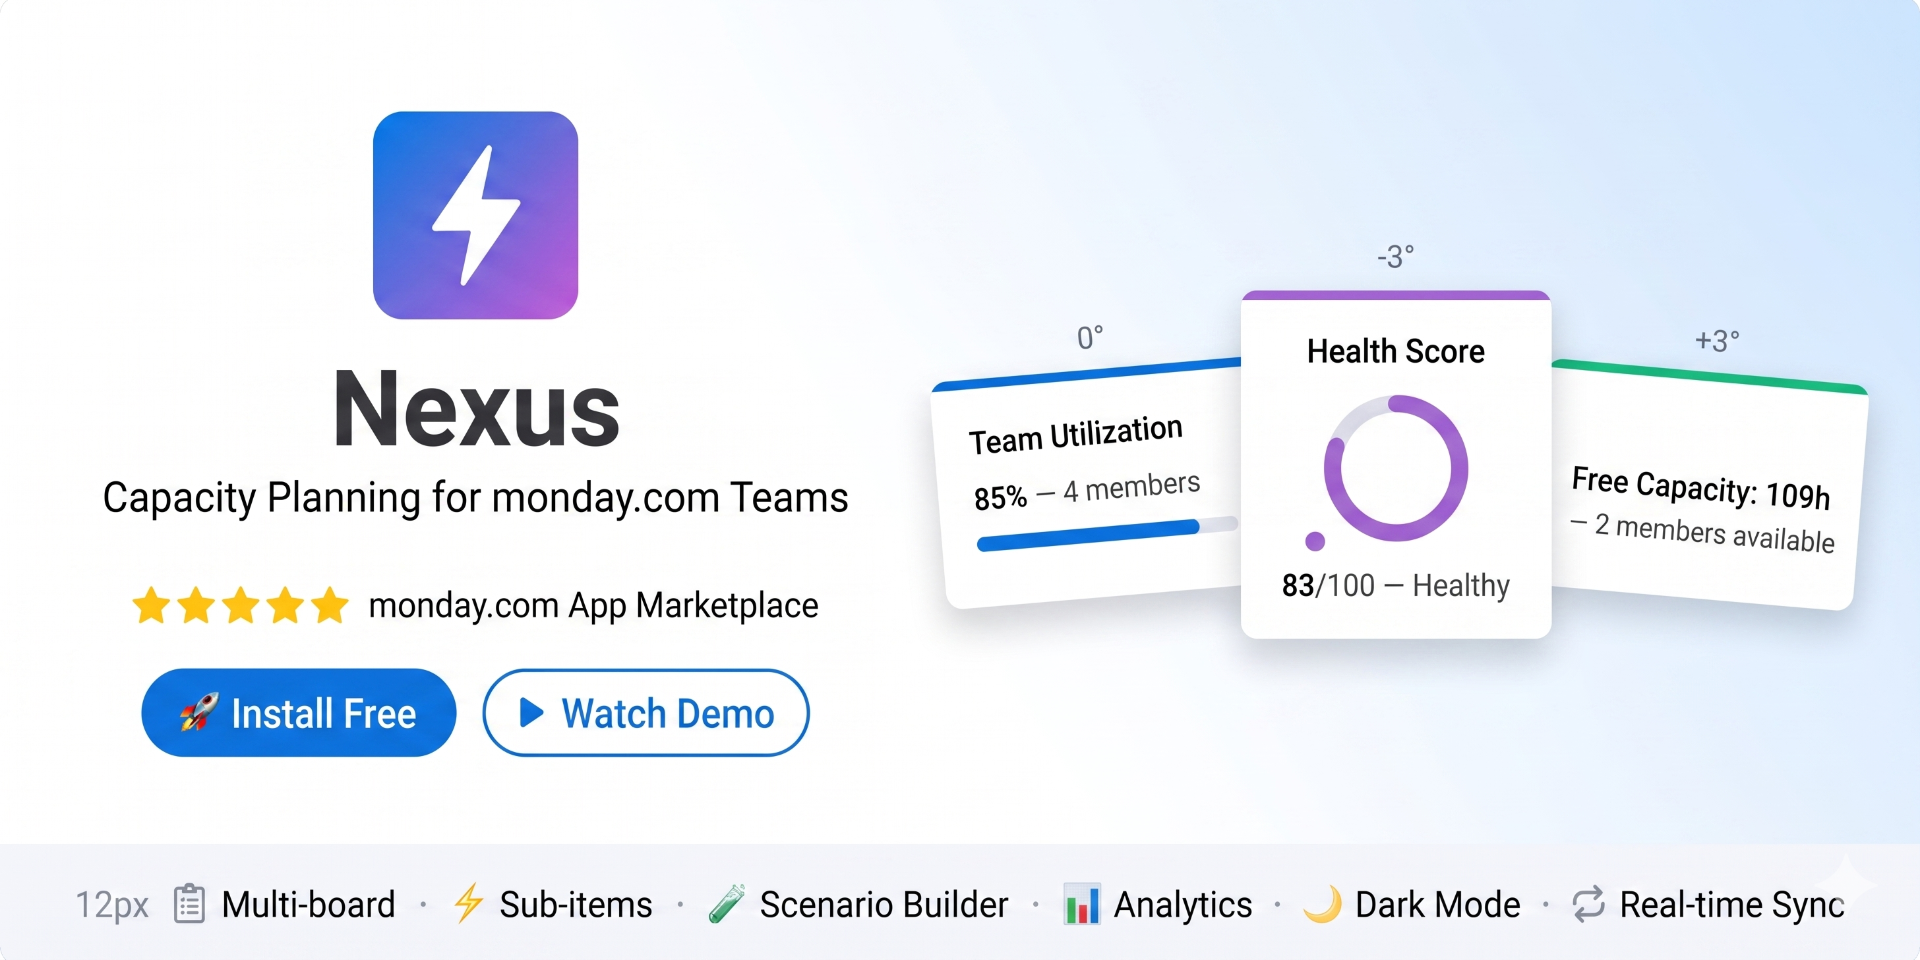
Nexus transforms your monday.com boards into a real‑time capacity intelligence system. Instantly see who’s overloaded, who’s available, and how to rebalance your team — before delays happen.
Built natively for monday.com, Nexus analyzes your tasks, timelines, estimations, and statuses to give you a clear, actionable view of your team’s workload.
⚡ What Nexus Gives You
• Instant Overload Detection
Automatically identify overloaded team members the moment risk appears.
• Interactive Timeline View
Visualize every task across your team. Spot conflicts, overlaps, and critical load in seconds.
• Team Health Score
A clear, data‑driven score that reflects your team’s capacity balance — so you know when to act.
• Scenario Builder (What‑If Mode)
Simulate task moves or estimation changes locally. Watch health and delay risk improve in real time. Sync changes to monday with one click.
• Real‑Time Analytics
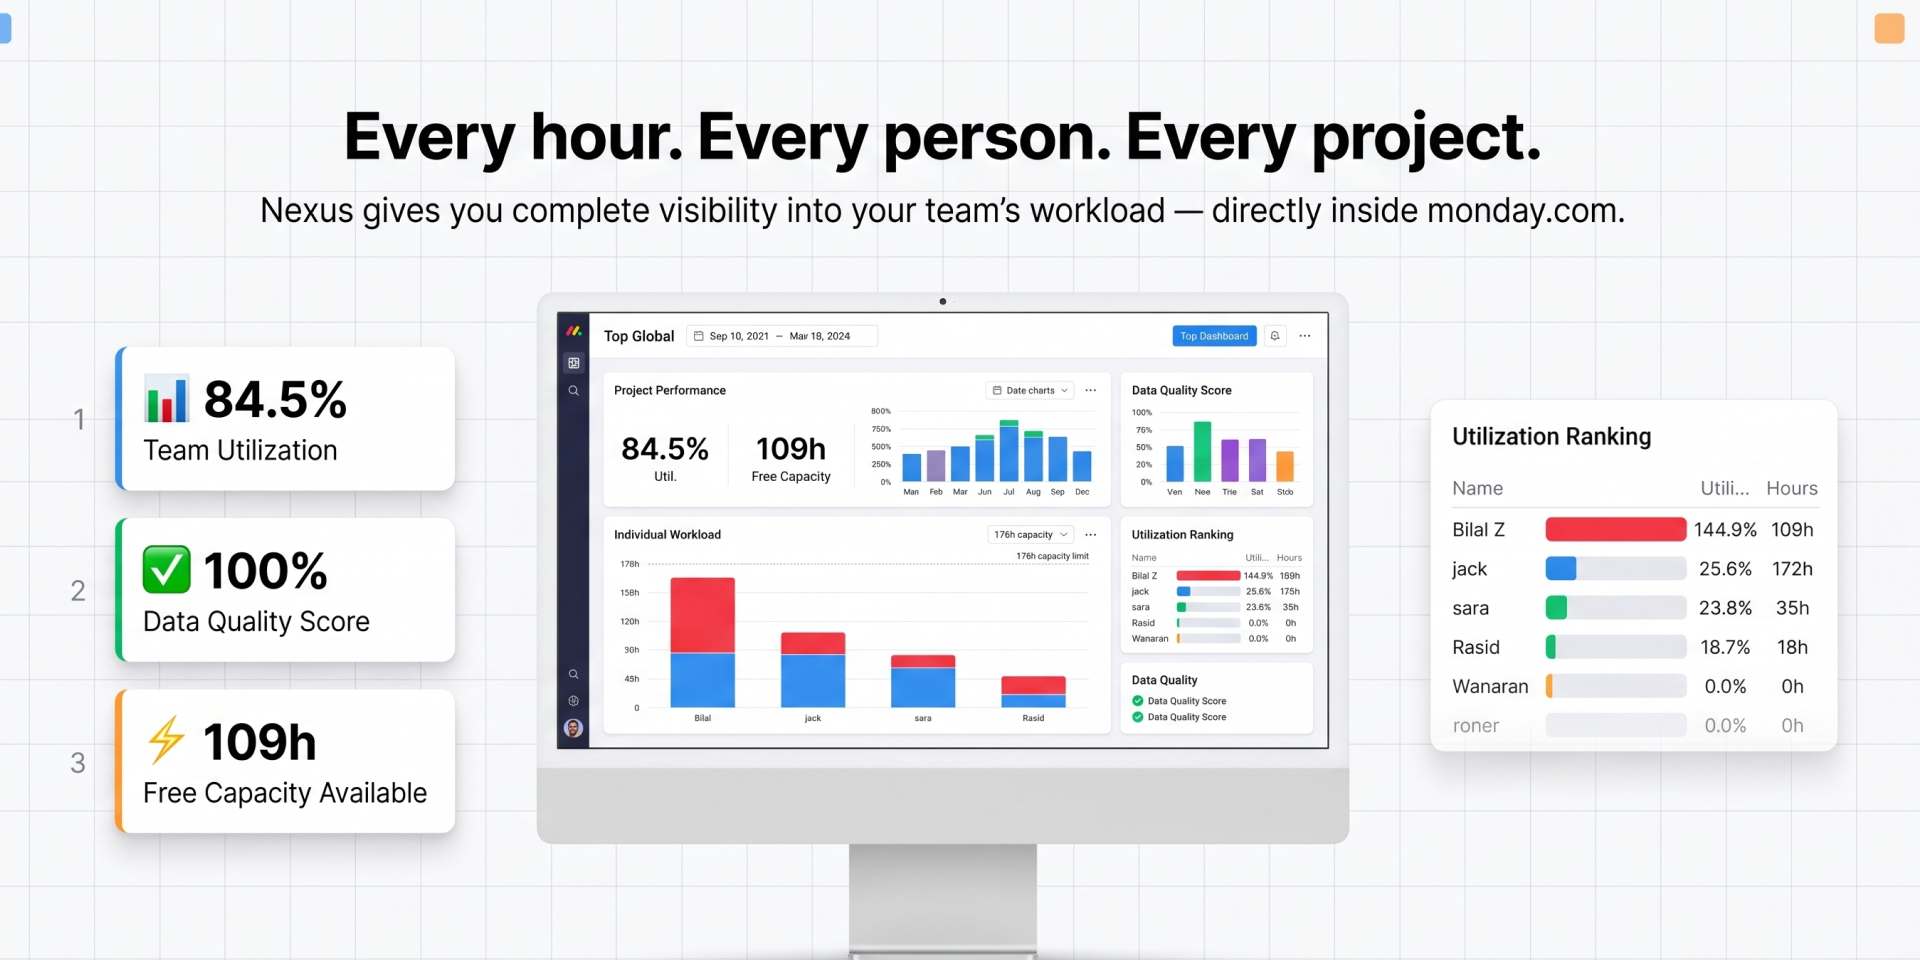
Track utilization, free capacity, bottlenecks, and delay risk — all from a single dashboard.
• Member Intelligence
Drill into any team member to see active load, peak days, completed work, and over‑capacity trends.
🚀 Designed for Modern Teams
Whether you’re managing product launches, marketing campaigns, development sprints, or cross‑functional initiatives — Nexus helps you:
Prevent burnout
Reduce delivery risk
Balance workload intelligently
Make data‑driven decisions
Eliminate manual capacity tracking
🔄 Seamless monday.com Integration
✅No complex setup.
✅No duplicate work.
✅No external spreadsheets.
✅Nexus works directly with your existing monday boards and respects your current workflows.
📈 The Result
🎯Clear visibility.
🎯Confident planning.
🎯Healthier teams.
🎯On‑time delivery.
Nexus — Know before it’s too late.
Available now on the monday.com Marketplace.
Security & Compliance
The app developer did not provide the security and compliance information for this app.
Reviews
No reviews yet.
Historical data
Installation history
We have data for December 28, 2024 onwards only. Collected sometime after 00:00 UTC daily.
Total number of installs
Change in total number of installs in last 1 day(s)
Compares the number of installs on each date with 1 days previously:
Max
Min
Current
Change in total number of installs in last 7 day(s)
Compares the number of installs on each date with 7 days previously:
Max
Min
Current
Change in total number of installs in last 30 day(s)
Compares the number of installs on each date with 30 days previously:
Max
Min
Current
Change in total number of installs in last 90 day(s)
Compares the number of installs on each date with 90 days previously:
Max
Min
Current
Change in total number of installs in last 180 day(s)
Compares the number of installs on each date with 180 days previously:
Max
Min
Current
Ratings history
Categories history
Each of the following is a yes/no answer, so the graphs show 1 for yes, and 0 for no.