Roll up numbers across many boards into one real column
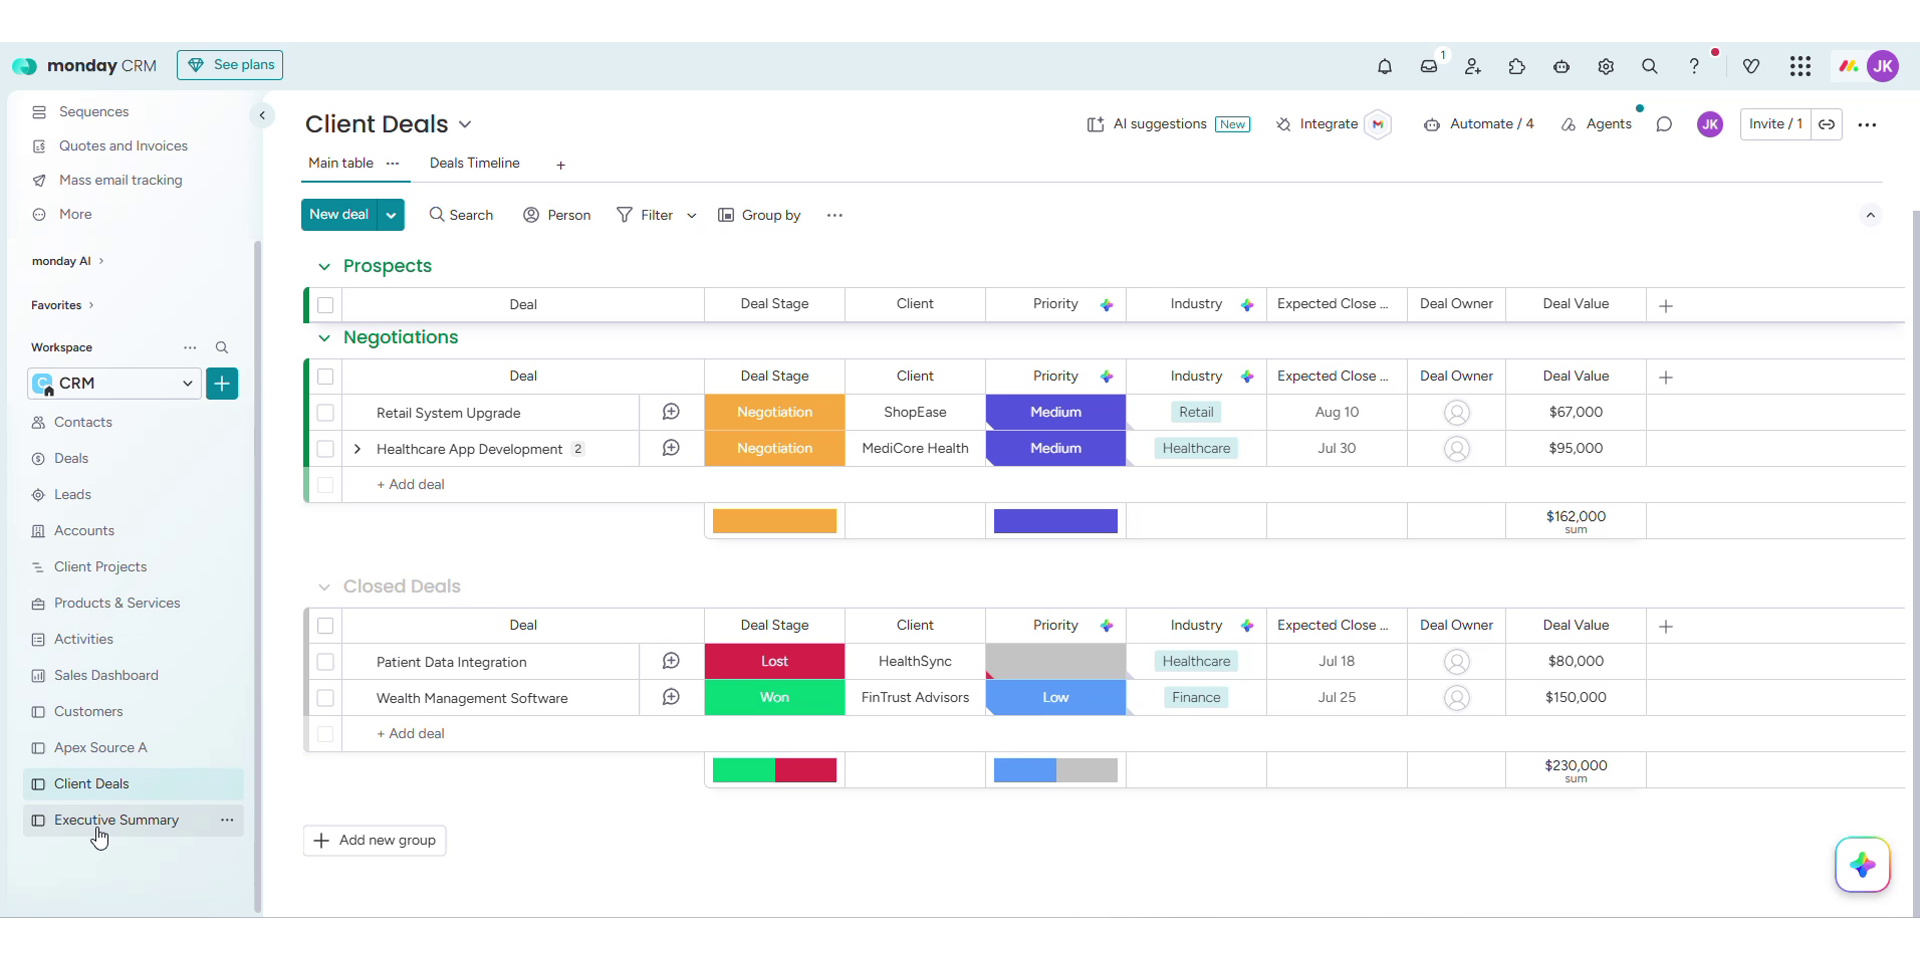
monday formula columns only calculate within a single board, and they are read-only. Rolling up a total across many boards natively - "total spend across 40 client boards", or "open items across every team" - means manual copy-paste into a spreadsheet. The community has asked for cross-board rollups for years.
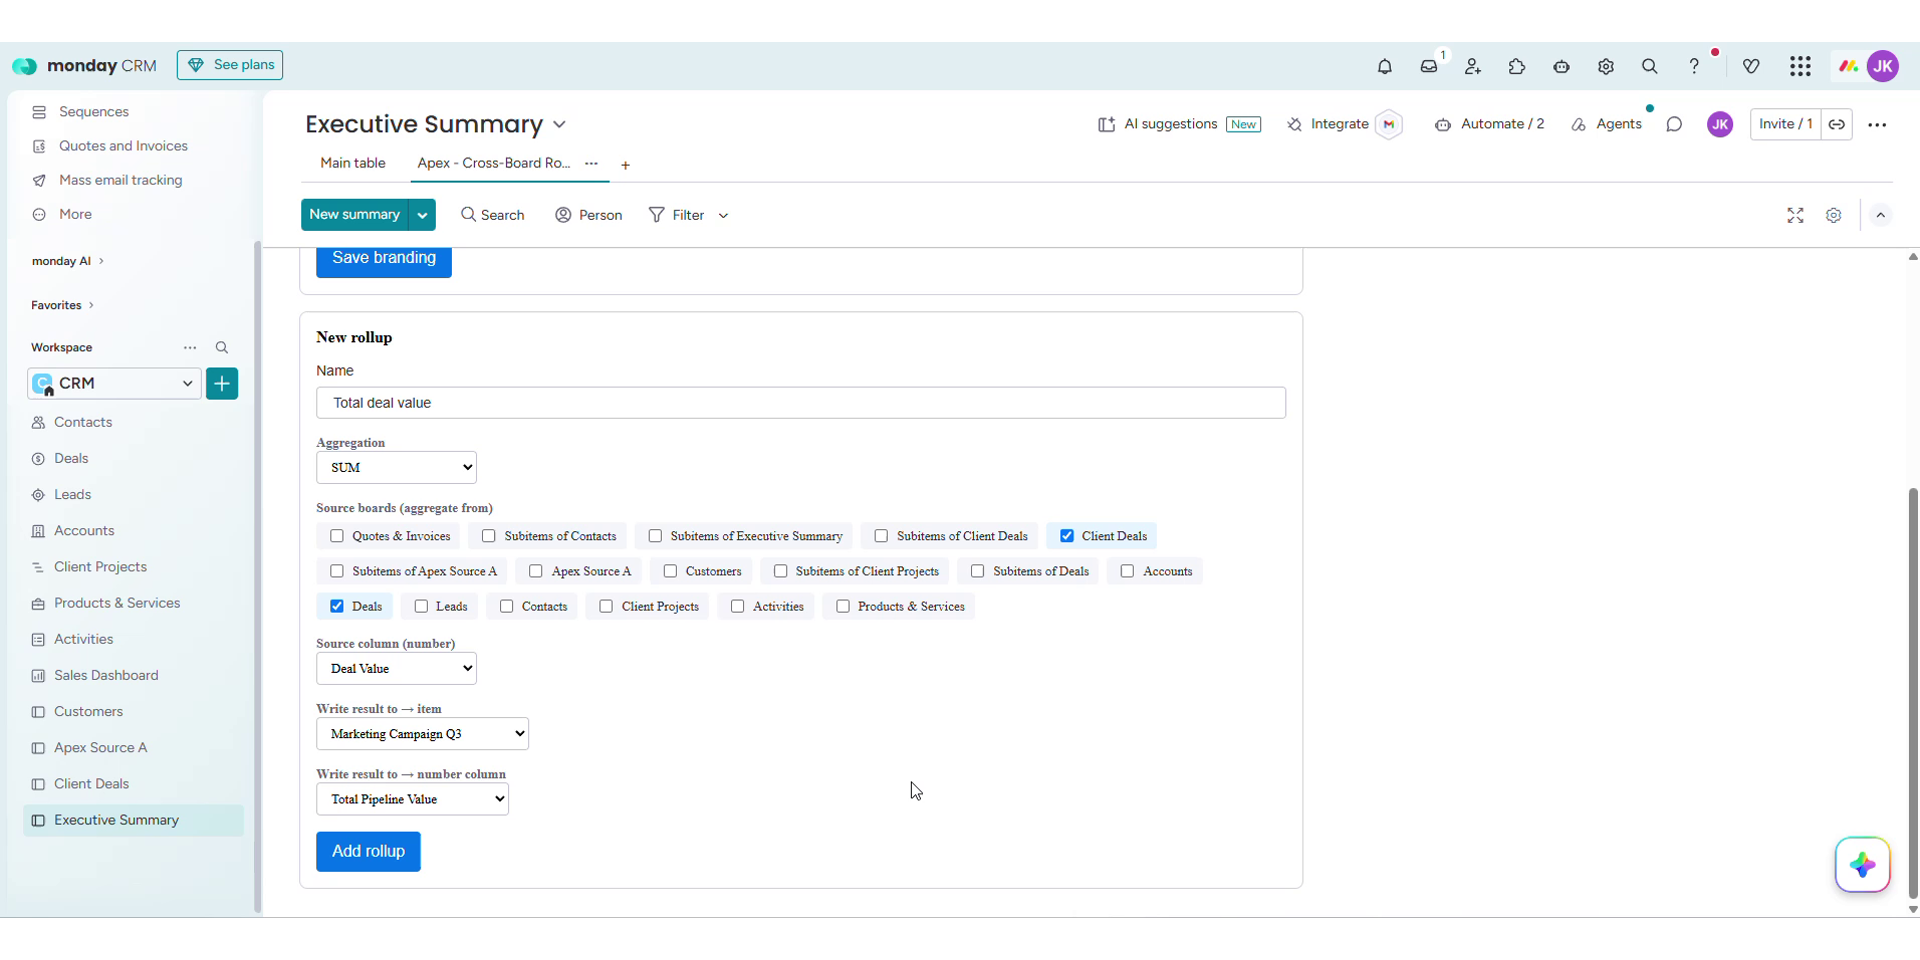
Apex does it in one screen:
- Pick any boards in your account. No rigid master-board or template model.
- Choose the number column (matched by title), or just count items.
- Choose the aggregation: SUM, COUNT, AVG, MIN, or MAX.
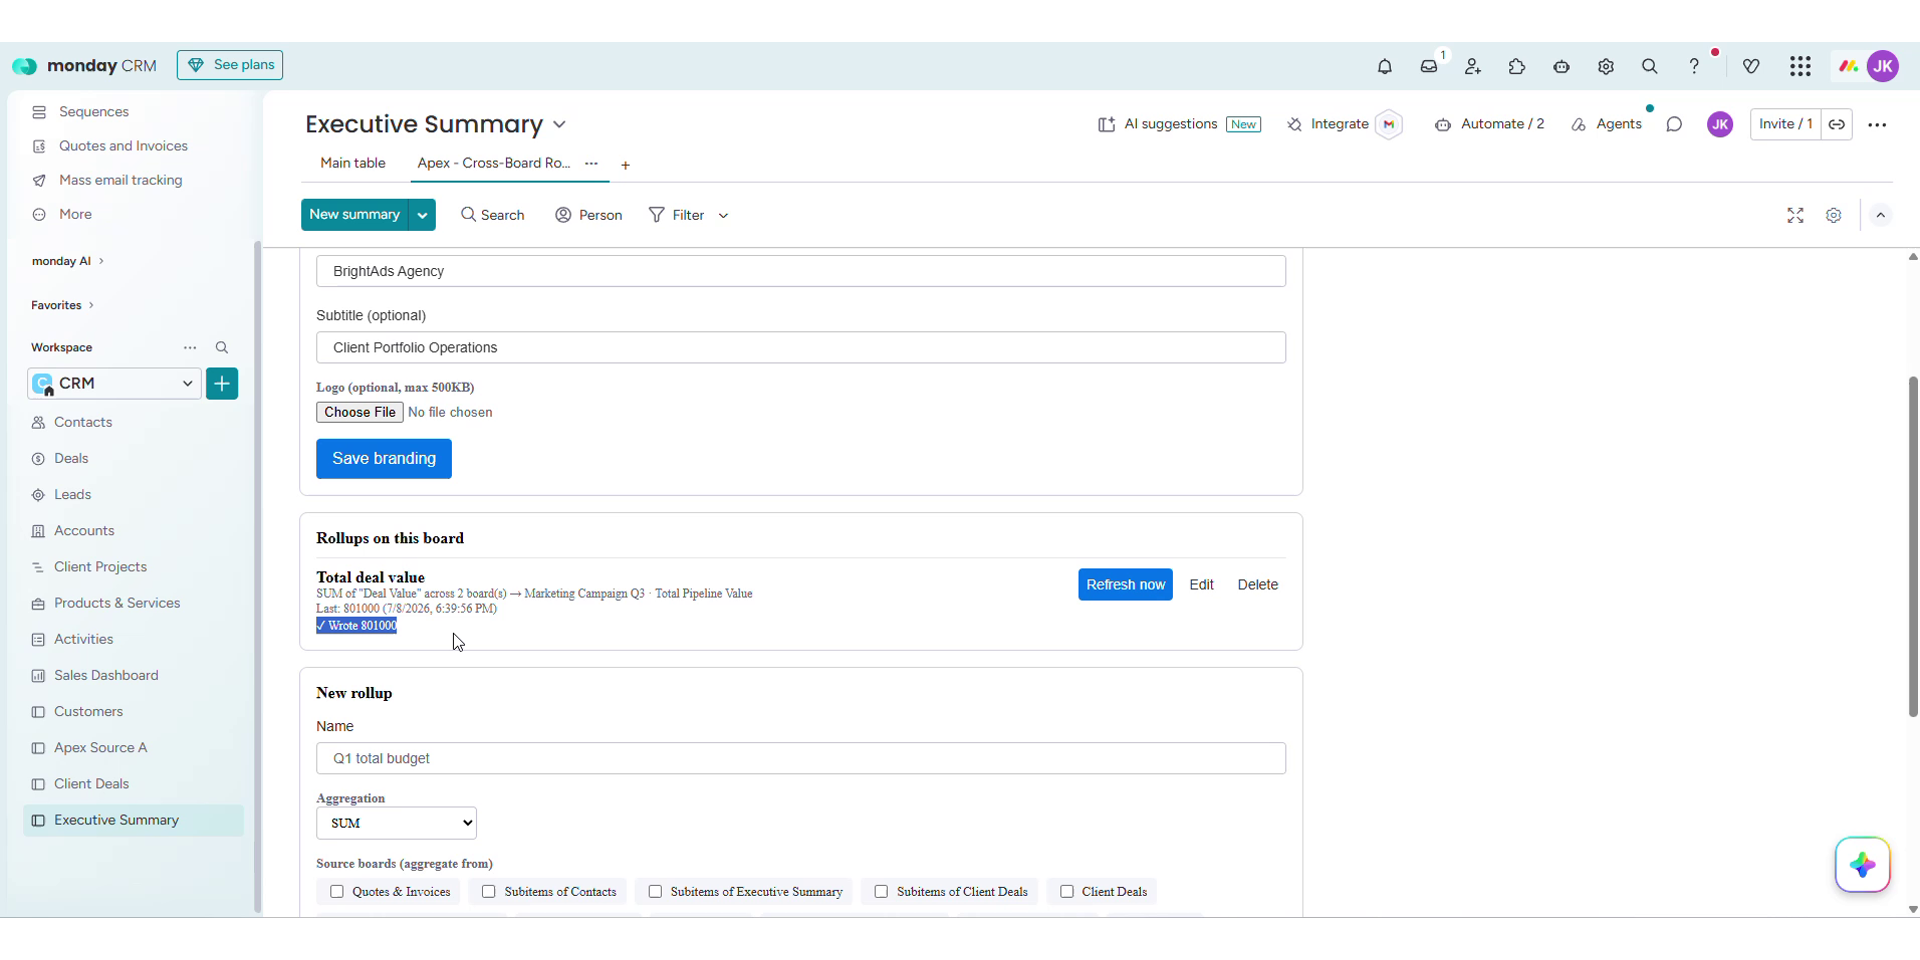
- Apex writes the result into a real Number column on your summary board.
Because the result is a real, editable column - not a read-only mirror column or a dashboard-only widget - you can sort by it, filter on it, and trigger "when column changes" automations from it. Mirror columns allow none of that.
Refresh your rollups on demand with one click.
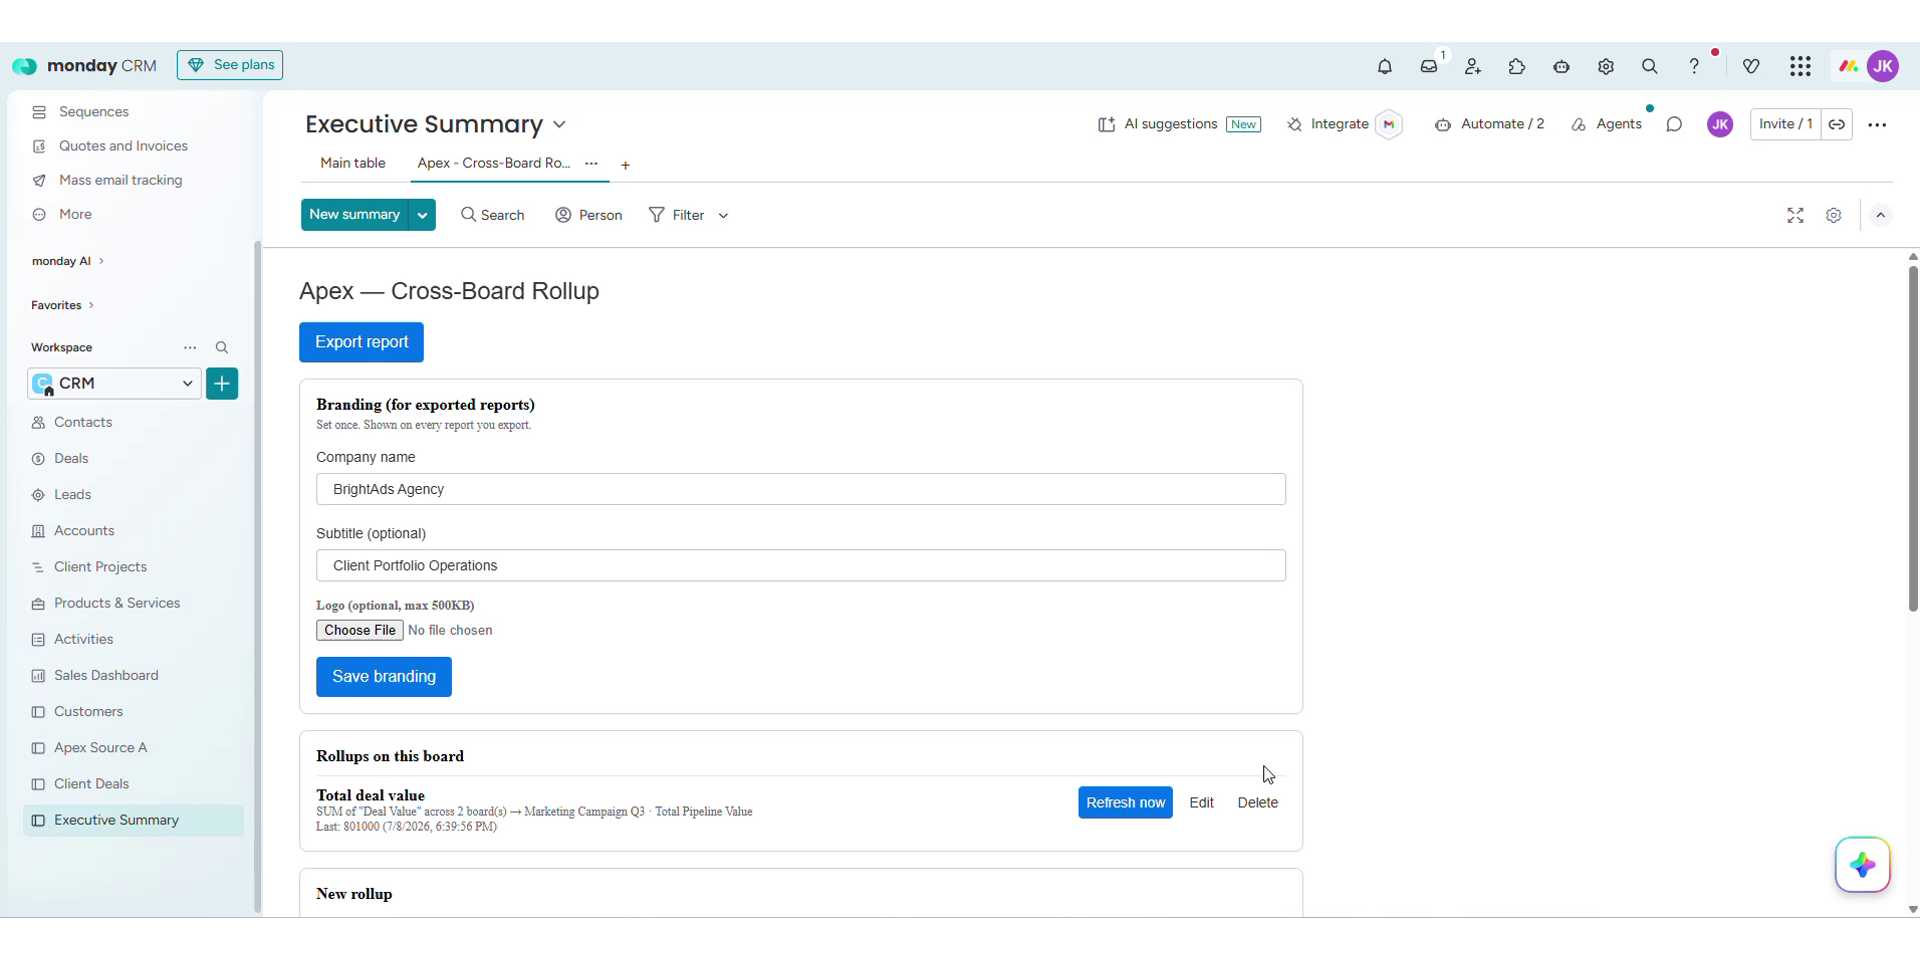
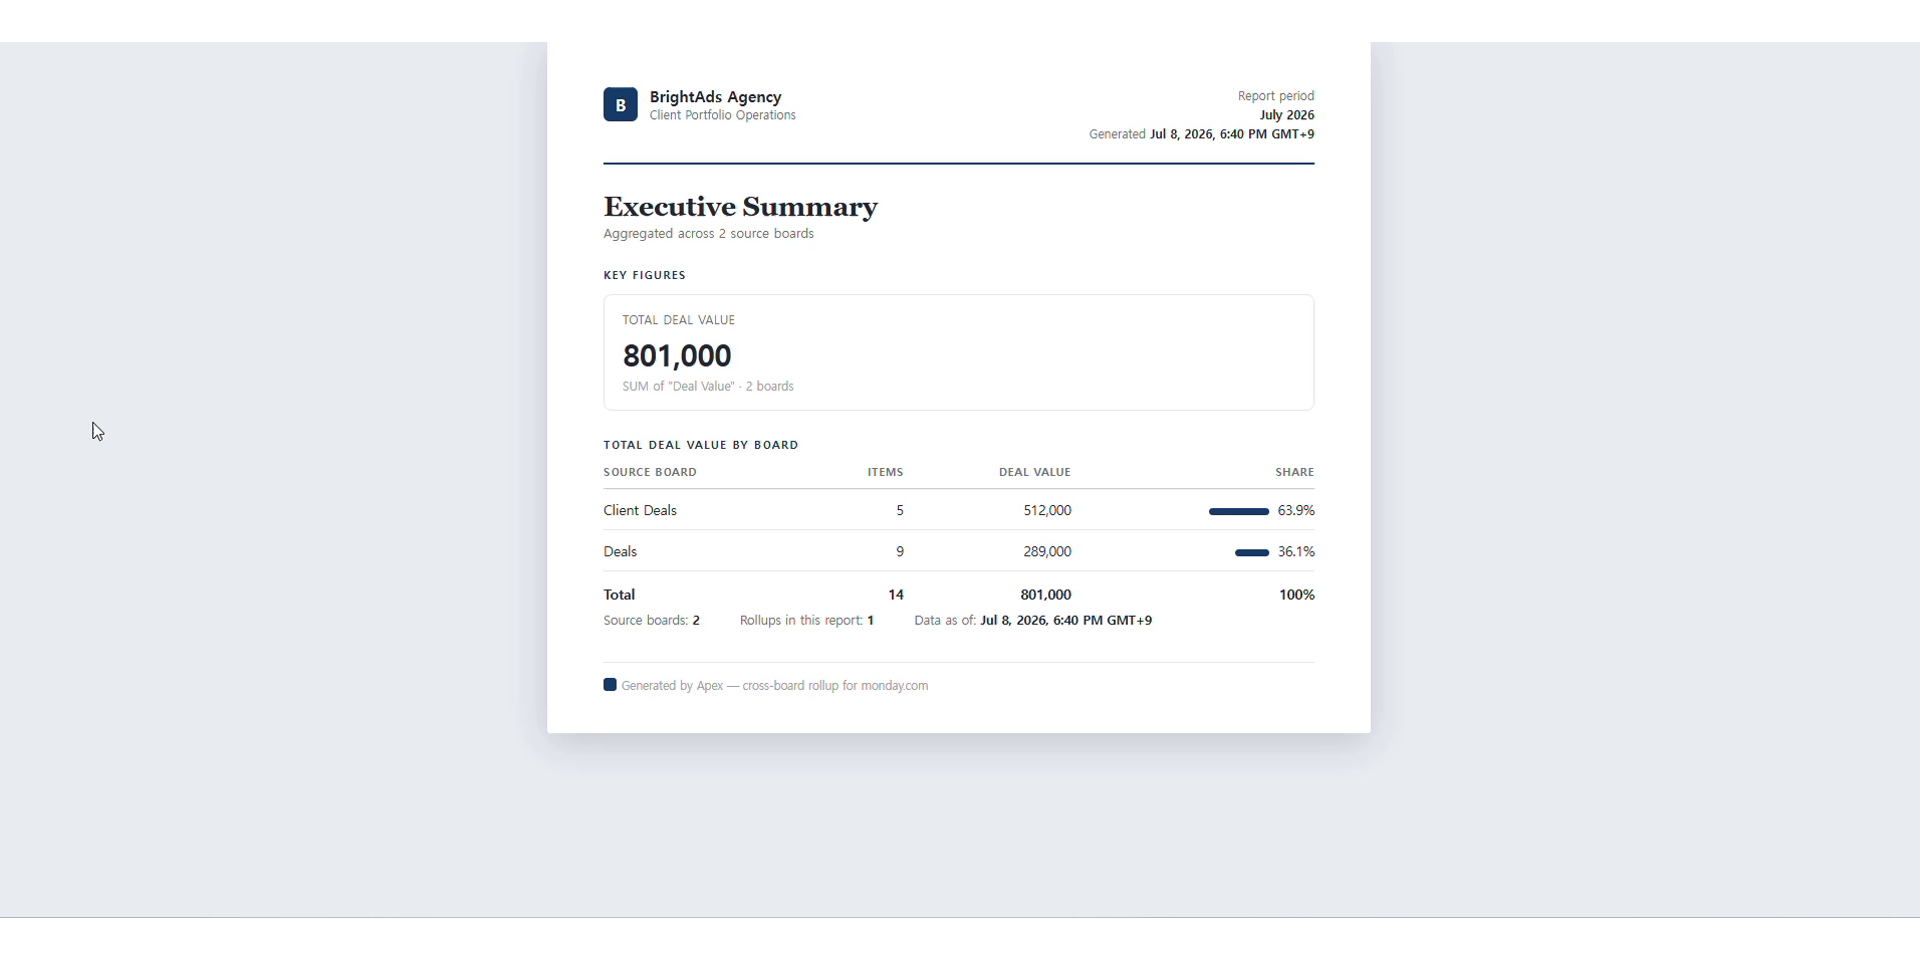
Built-in Export report: turn your rollups into a one-page branded KPI report, with your company name and logo and a per-board breakdown. Open it in a new tab and save as PDF - no external tools.
Apex is for RevOps, PMO, agency owners, and finance leads who run monday as a system of record and need cross-board totals for leadership reporting.
Free to start.
Security & Compliance
The app developer did not provide the security and compliance information for this app.
Reviews
No reviews yet.
Historical data
Installation history
We have data for December 28, 2024 onwards only. Collected sometime after 00:00 UTC daily.
Total number of installs
Change in total number of installs in last 1 day(s)
Compares the number of installs on each date with 1 days previously:
Max
Min
Current
Change in total number of installs in last 7 day(s)
Compares the number of installs on each date with 7 days previously:
Max
Min
Current
Change in total number of installs in last 30 day(s)
Compares the number of installs on each date with 30 days previously:
Max
Min
Current
Change in total number of installs in last 90 day(s)
Compares the number of installs on each date with 90 days previously:
Max
Min
Current
Change in total number of installs in last 180 day(s)
Compares the number of installs on each date with 180 days previously:
Max
Min
Current
Ratings history
Categories history
Each of the following is a yes/no answer, so the graphs show 1 for yes, and 0 for no.
{
  "id": 10001288,
  "marketplace_developer_id": 100000264,
  "app_id": 11639948,
  "app_type": "app",
  "security_info": {},
  "gallery_assets": [
    {
      "url": "https://cdn.monday.com/marketplace/10001288/10001288_2026_9_13_9_15_40_lcc6if.png",
      "type": "image"
    },
    {
      "url": "https://cdn.monday.com/marketplace/10001288/10001288_2026_9_13_9_15_47_e4sicqql.png",
      "type": "image"
    },
    {
      "url": "https://cdn.monday.com/marketplace/10001288/10001288_2026_9_13_9_15_55_2dwdims.png",
      "type": "image"
    },
    {
      "url": "https://cdn.monday.com/marketplace/10001288/10001288_2026_9_13_9_16_5_4ms9hntk.png",
      "type": "image"
    },
    {
      "url": "https://cdn.monday.com/marketplace/10001288/10001288_2026_9_13_9_16_12_6uewn0t.png",
      "type": "image"
    },
    {
      "url": "https://cdn.monday.com/marketplace/10001288/10001288_2026_9_13_9_17_2_skvez9wg.mp4",
      "type": "video"
    }
  ],
  "description": "<p>monday formula columns only calculate within a single board, and they are read-only. Rolling up a total across many boards natively - \"total spend across 40 client boards\", or \"open items across every team\" - means manual copy-paste into a spreadsheet. The community has asked for cross-board rollups for years.</p><p>Apex does it in one screen:</p><p>- Pick any boards in your account. No rigid master-board or template model.</p><p>- Choose the number column (matched by title), or just count items.</p><p>- Choose the aggregation: SUM, COUNT, AVG, MIN, or MAX.</p><p>- Apex writes the result into a real Number column on your summary board.</p><p>Because the result is a real, editable column - not a read-only mirror column or a dashboard-only widget - you can sort by it, filter on it, and trigger \"when column changes\" automations from it. Mirror columns allow none of that.</p><p>Refresh your rollups on demand with one click.</p><p>Built-in Export report: turn your rollups into a one-page branded KPI report, with your company name and logo and a per-board breakdown. Open it in a new tab and save as PDF - no external tools.</p><p>Apex is for RevOps, PMO, agency owners, and finance leads who run monday as a system of record and need cross-board totals for leadership reporting.</p><p>Free to start.</p>",
  "short_description": "Roll up numbers across many boards into one real column",
  "thumbnail_url": "https://cdn.monday.com/marketplace/10001288/10001288_2026_9_13_9_14_52_3z8u0n9.png",
  "logo_url": "https://cdn.monday.com/marketplace/10001288/10001288_2026_9_13_9_14_6_vqc48wv.png",
  "feedback_url": "hello@tovrio.com",
  "privacy_policy_url": "https://www.tovrio.com/privacy",
  "featured": false,
  "name": "Apex - Cross-Board Rollup",
  "how_to_use_url": "https://www.tovrio.com/apps/apex/guide",
  "external_pricing_url": null,
  "keywords": "rollup,cross-board,roll up,aggregate,sum,summary,reporting,kpi,totals,dashboard",
  "compliance_answers": [],
  "created_at": "2026-10-13T09:07:38.000Z",
  "updated_at": "2026-10-13T09:17:06.000Z",
  "automation_app_id": null,
  "marketplace_category_ids": [],
  "pinned_for_categories_ids": [],
  "featured_for_categories_ids": [],
  "pricing_data": "Free plan available",
  "label": null,
  "app_values": [
    "Everyday tasks"
  ],
  "security": false,
  "display_in_template_store": false,
  "acquisition_source": "No touch",
  "is_connector": false,
  "show_connections": false,
  "terms_of_service_url": "https://www.tovrio.com/terms",
  "available_for_tiers": [],
  "available_for_products": [],
  "google_analytics_tag_id": null,
  "is_solution": false,
  "cta_override": null,
  "app_scope_str": "boards:read,boards:write,me:read,account:read",
  "app_client_id": "390c7a1150b833a944f63e58c57ac16a",
  "app_color": "#CF681F",
  "plans": null,
  "app_live_version": {
    "updated_at": "2026-09-30T05:49:48.601Z",
    "id": 18404452
  },
  "pricing_model": null,
  "monetization": {
    "monetizationType": "none",
    "hasFreePlan": false,
    "hasPaidPlan": false,
    "hasTrialPlan": false
  },
  "badges_data": {
    "security": false,
    "app_values": [
      "Everyday tasks"
    ],
    "pricing_data": "Free plan available",
    "acquisition_source": "No touch",
    "display_in_template_store": false
  },
  "data": {
    "is_solution": false,
    "cta_override": null,
    "is_connector": false,
    "show_connections": false,
    "available_for_tiers": [],
    "terms_of_service_url": "https://www.tovrio.com/terms",
    "available_for_products": [],
    "google_analytics_tag_id": null
  },
  "display": null,
  "installsDelta": {
    "totalInstalls": 3
  }
}