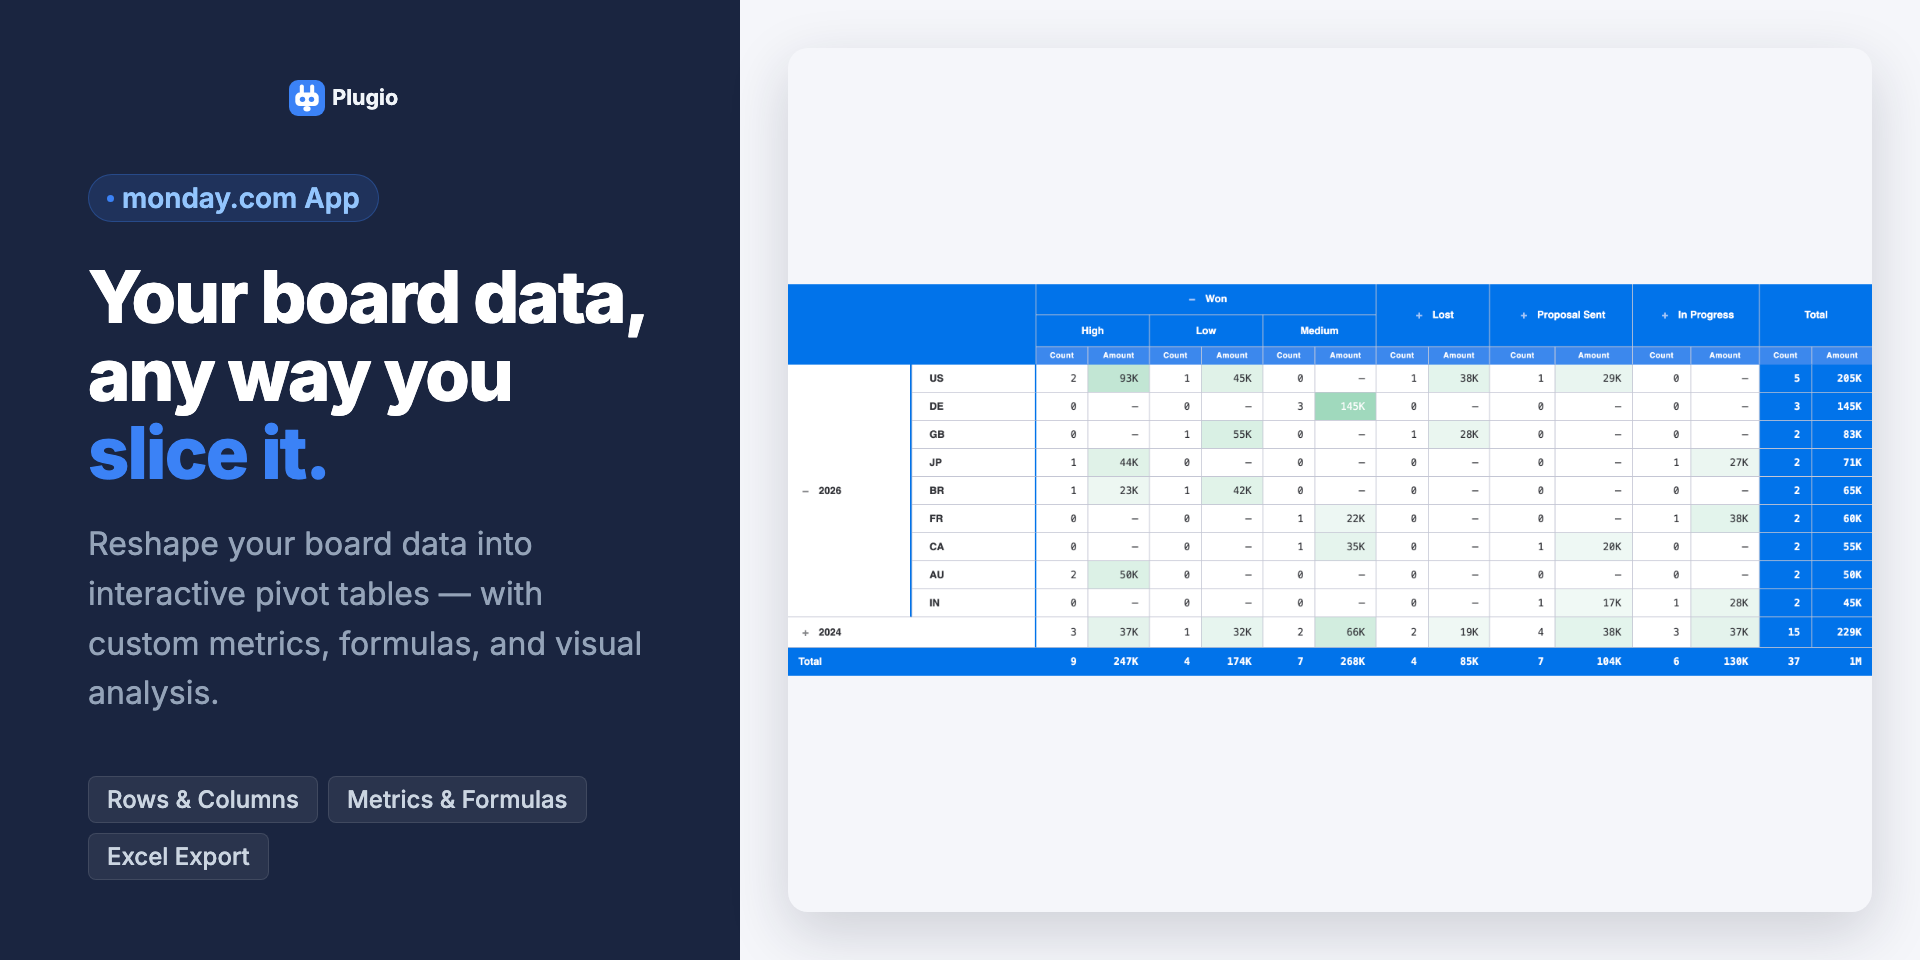
Plugio Pivot Table turns any monday.com board into a fully interactive, multi-dimensional pivot table — without leaving your dashboard.
Drag. Drop. Analyze.
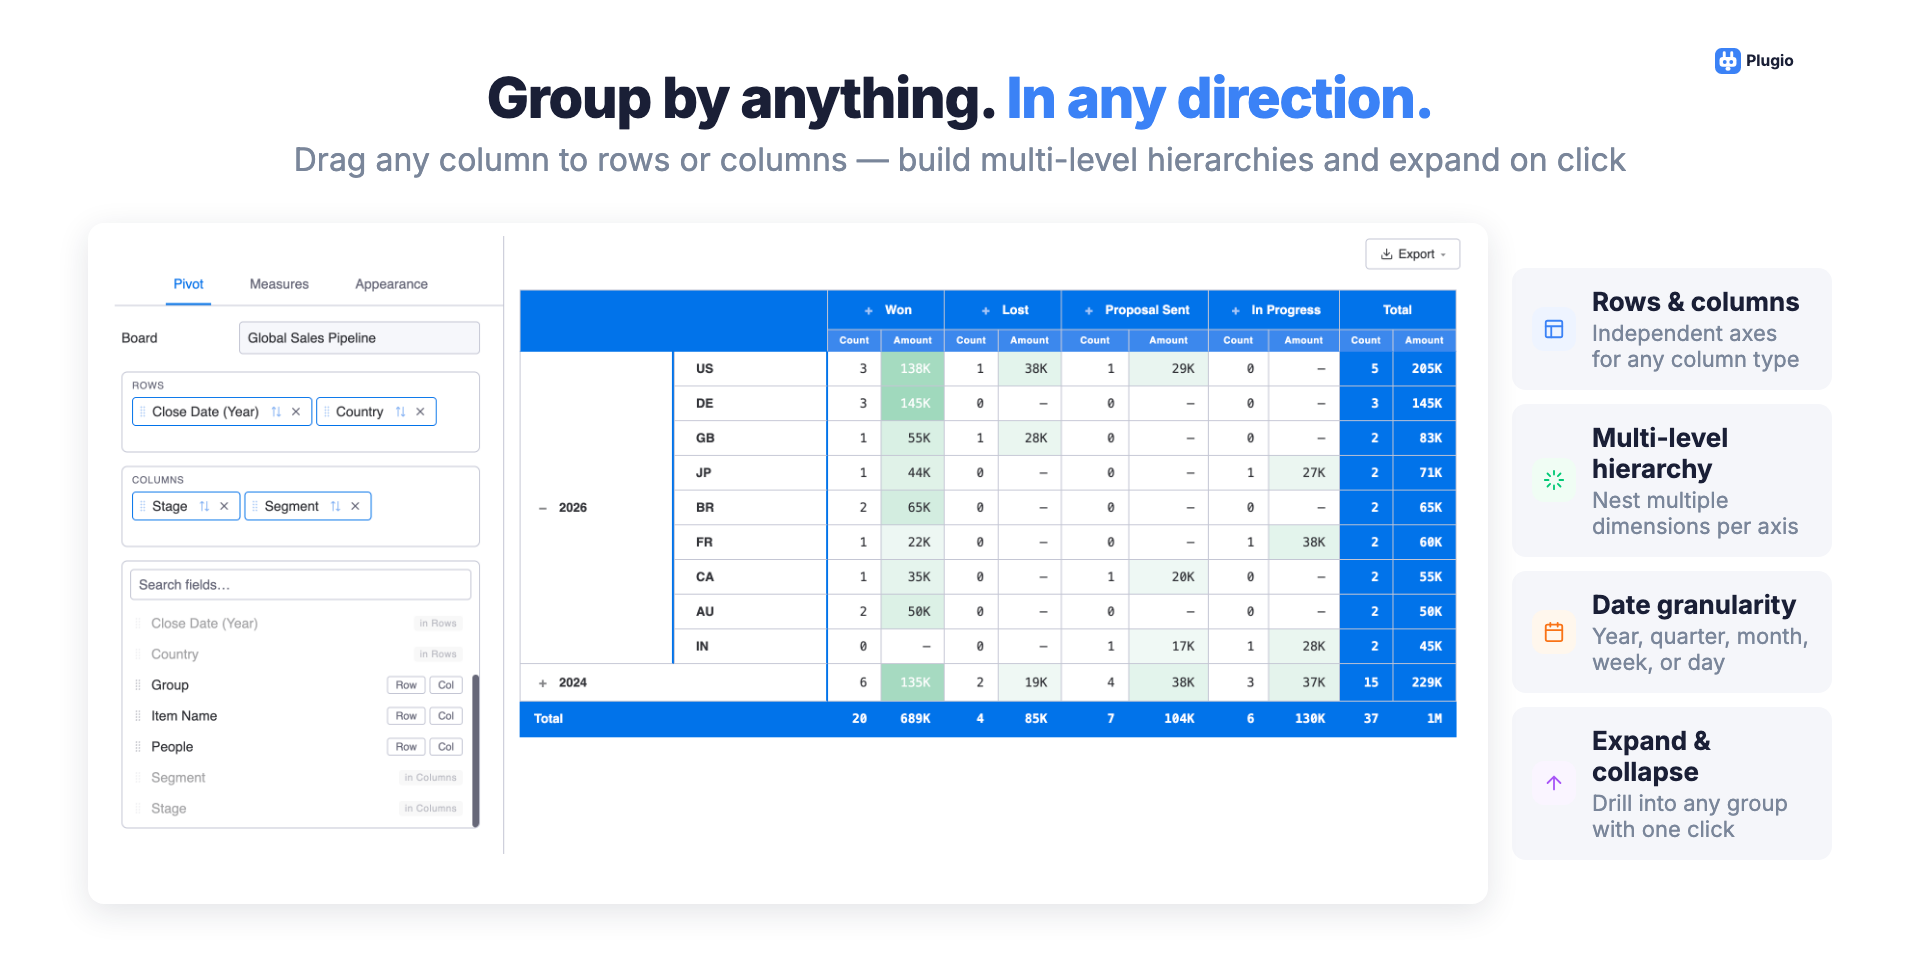
Build your pivot in seconds: drag any column into the Rows or Columns zone and the table updates instantly. Stack multiple dimensions per axis for nested hierarchies, and expand or collapse any group with one click.
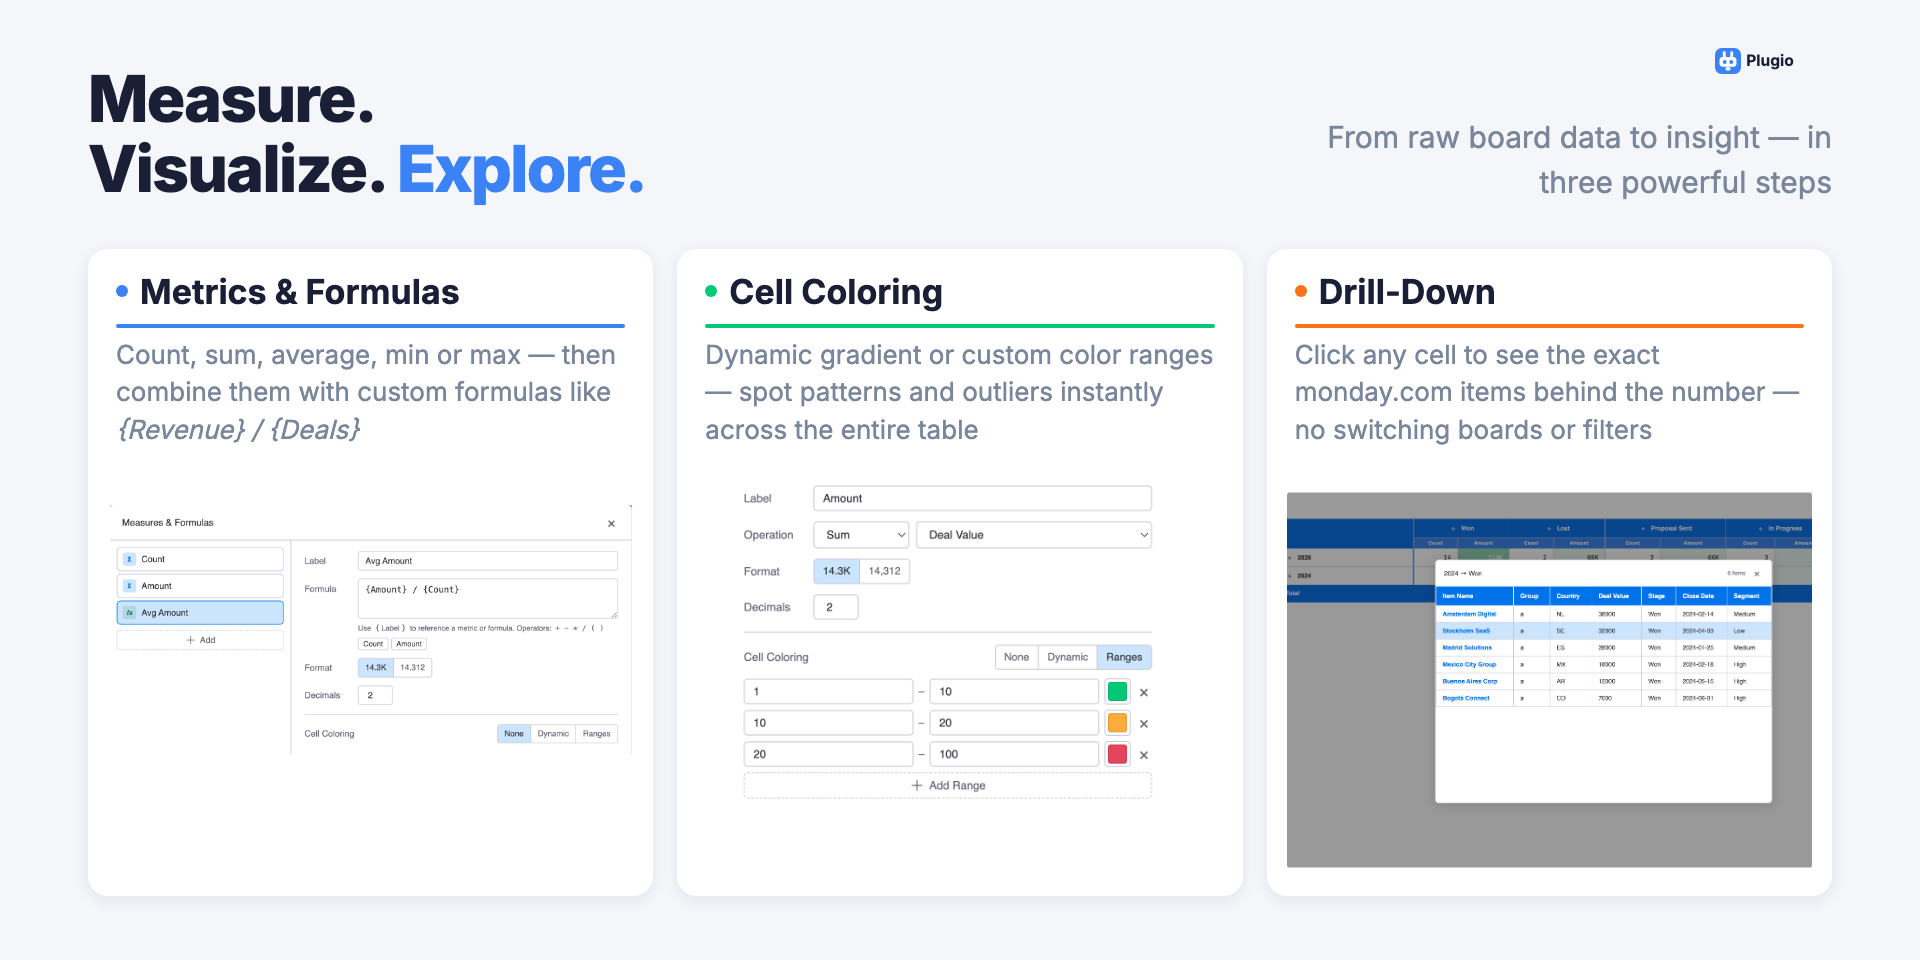
Metrics & Formulas
Go beyond a simple count. Aggregate any numeric column with Sum, Average, Min, or Max — or define custom formula metrics using expressions like {Revenue} / {Deals}. Circular dependency detection included.
See patterns instantly
Apply gradient or range-based color rules to any metric. Colors scale from the table's actual min and max, so outliers and trends stand out without any manual setup.
Drill down to the source
Click any cell to see the exact monday.com items behind the number. No board-switching, no manual filtering.
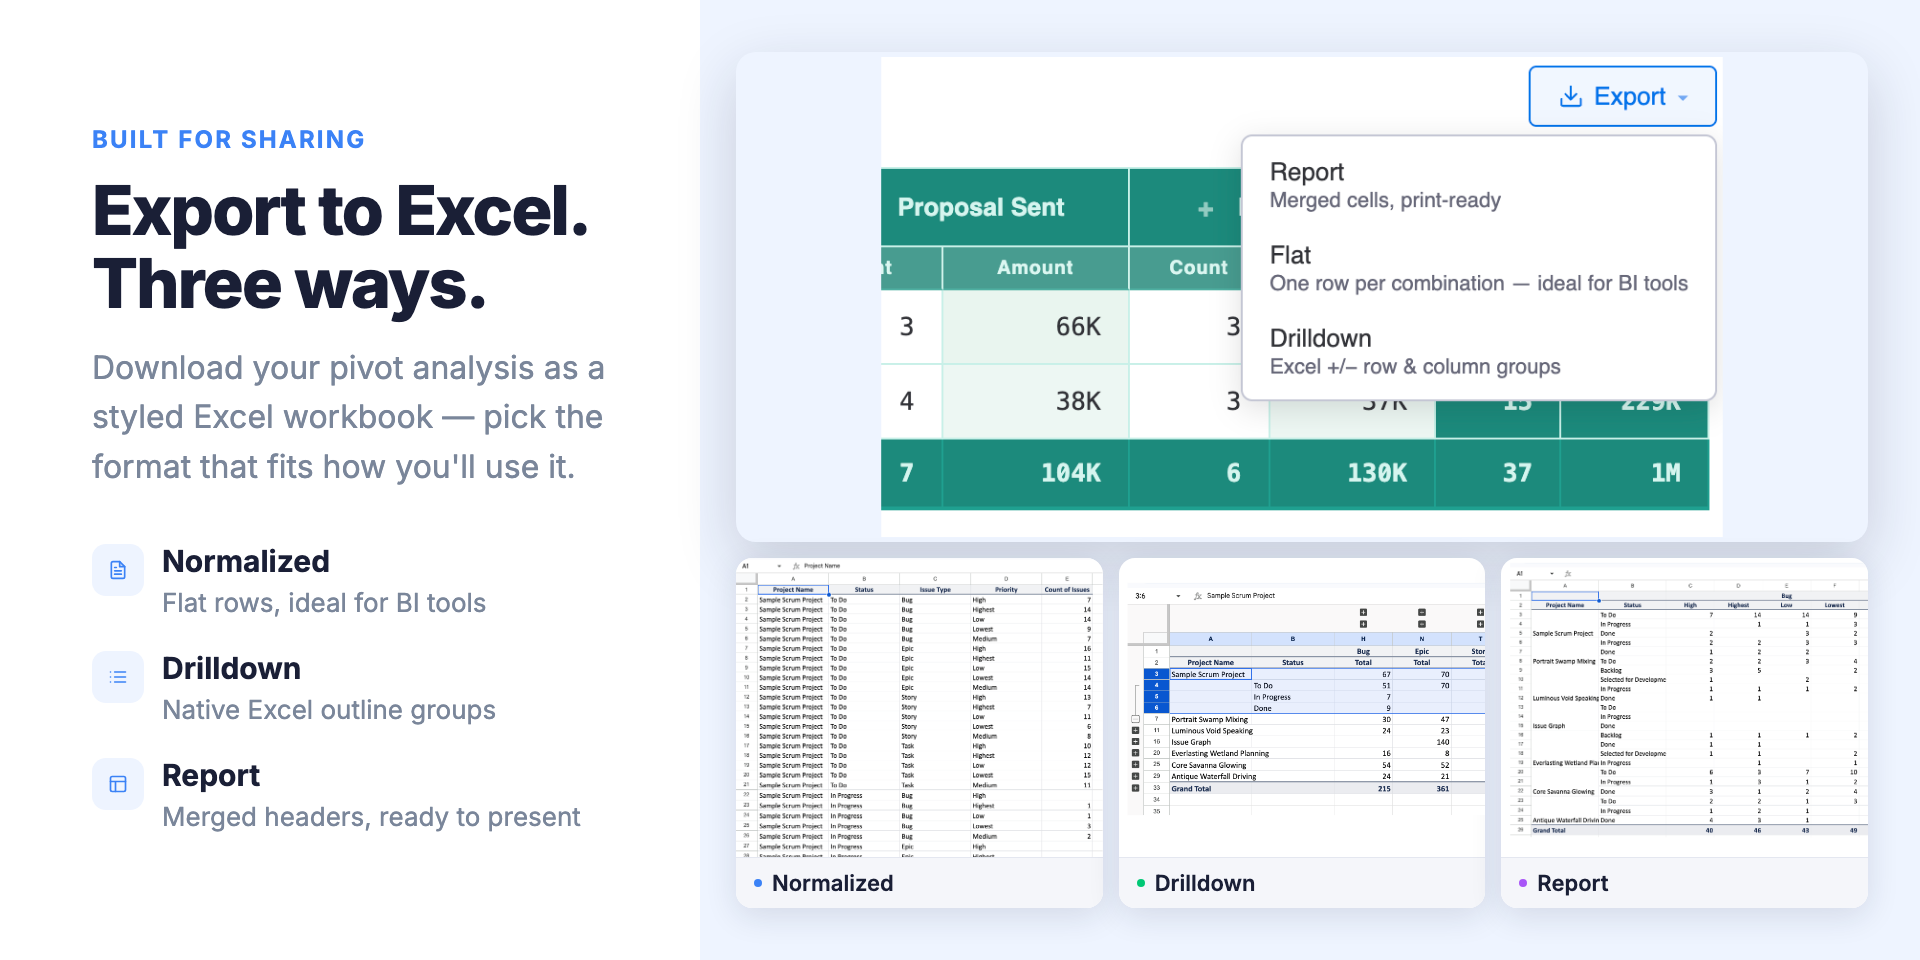
Export to Excel — three ways
• Normalized — flat structure, ready for BI tools
• Drilldown — native Excel outline groups with +/− expand
• Report — merged headers and bold totals, ready to present
Built for monday.com
• 6 themes including Monday Adaptive (follows your dashboard theme automatically)
• Freeze row and column headers independently
• Responds to dashboard-level filters — the pivot updates when viewers filter
• Row totals, column totals, and grand total, each independently toggleable
• Your data never leaves monday.com
Security & Compliance
Security
Does the developer periodically perform penetration testing?
Not answered
Does the developer have a dedicated security and privacy point of contact for such issues or questions?
Not answered
Does the app restrict redirects and forwards only to approved destinations, or show a warning when redirecting to potentially untrusted content?
Not answered
Does the app protect against mass parameter assignment attacks?
Not answered
Does the app perform encoding and sanitization on all user supplied parameters to protect against Cross-Site Scripting?
Not answered
Does the developer protect all state-changing actions against Cross-Site Request Forgery (CSRF)?
Not answered
Does the developer have mechanisms to notify monday.com in case of a security breach?
Not answered
Does this developer have a process for installing application-level updates and security patches for the service (such as software packages and databases)?
Not answered
Compliance
Is the app certified with the information security standard ISO/IEC 27001:2022?
Not answered
Is the app compliant with the Health Insurance Portability and Accountability Act (HIPAA)?
Not answered
Is the app certified with System and Organization Controls (SOC 2 or SOC 3)?
Not answered
Is the app compliant with the General Data Protection Regulation (GDPR)?
Not answered
Data
Does the app send any data outside of monday.com? If yes, indicate whether the data is customer-submitted (e.g., board names, item names, doc content) or non-customer-submitted (e.g., account ID, board ID, user ID).
No
Where does the app store logs data?
monday
No customer data is stored
Where does the app store the app data?
monday
No data is stored
Does the developer ensure application logs do not contain secrets or personally-identifiable information (PII)?
Yes
Application doesn't produce any logs at all
Is customer data segregated from the data of other customers (for example logically or physically)?
Yes
No customer data is stored
Privacy
Does the developer enforce multi-factor authentication on employees access to systems which may process customer data?
Not answered
Does the developer protect access to customer data based on the principle of least privilege?
Yes
Reviews
No reviews yet.
Historical data
Installation history
We have data for December 28, 2024 onwards only. Collected sometime after 00:00 UTC daily.
Total number of installs
Change in total number of installs in last 1 day(s)
Compares the number of installs on each date with 1 days previously:
Max
Min
Current
Change in total number of installs in last 7 day(s)
Compares the number of installs on each date with 7 days previously:
Max
Min
Current
Change in total number of installs in last 30 day(s)
Compares the number of installs on each date with 30 days previously:
Max
Min
Current
Change in total number of installs in last 90 day(s)
Compares the number of installs on each date with 90 days previously:
Max
Min
Current
Change in total number of installs in last 180 day(s)
Compares the number of installs on each date with 180 days previously:
Max
Min
Current
Ratings history
Categories history
Each of the following is a yes/no answer, so the graphs show 1 for yes, and 0 for no.