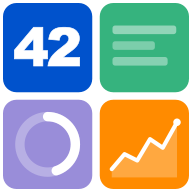
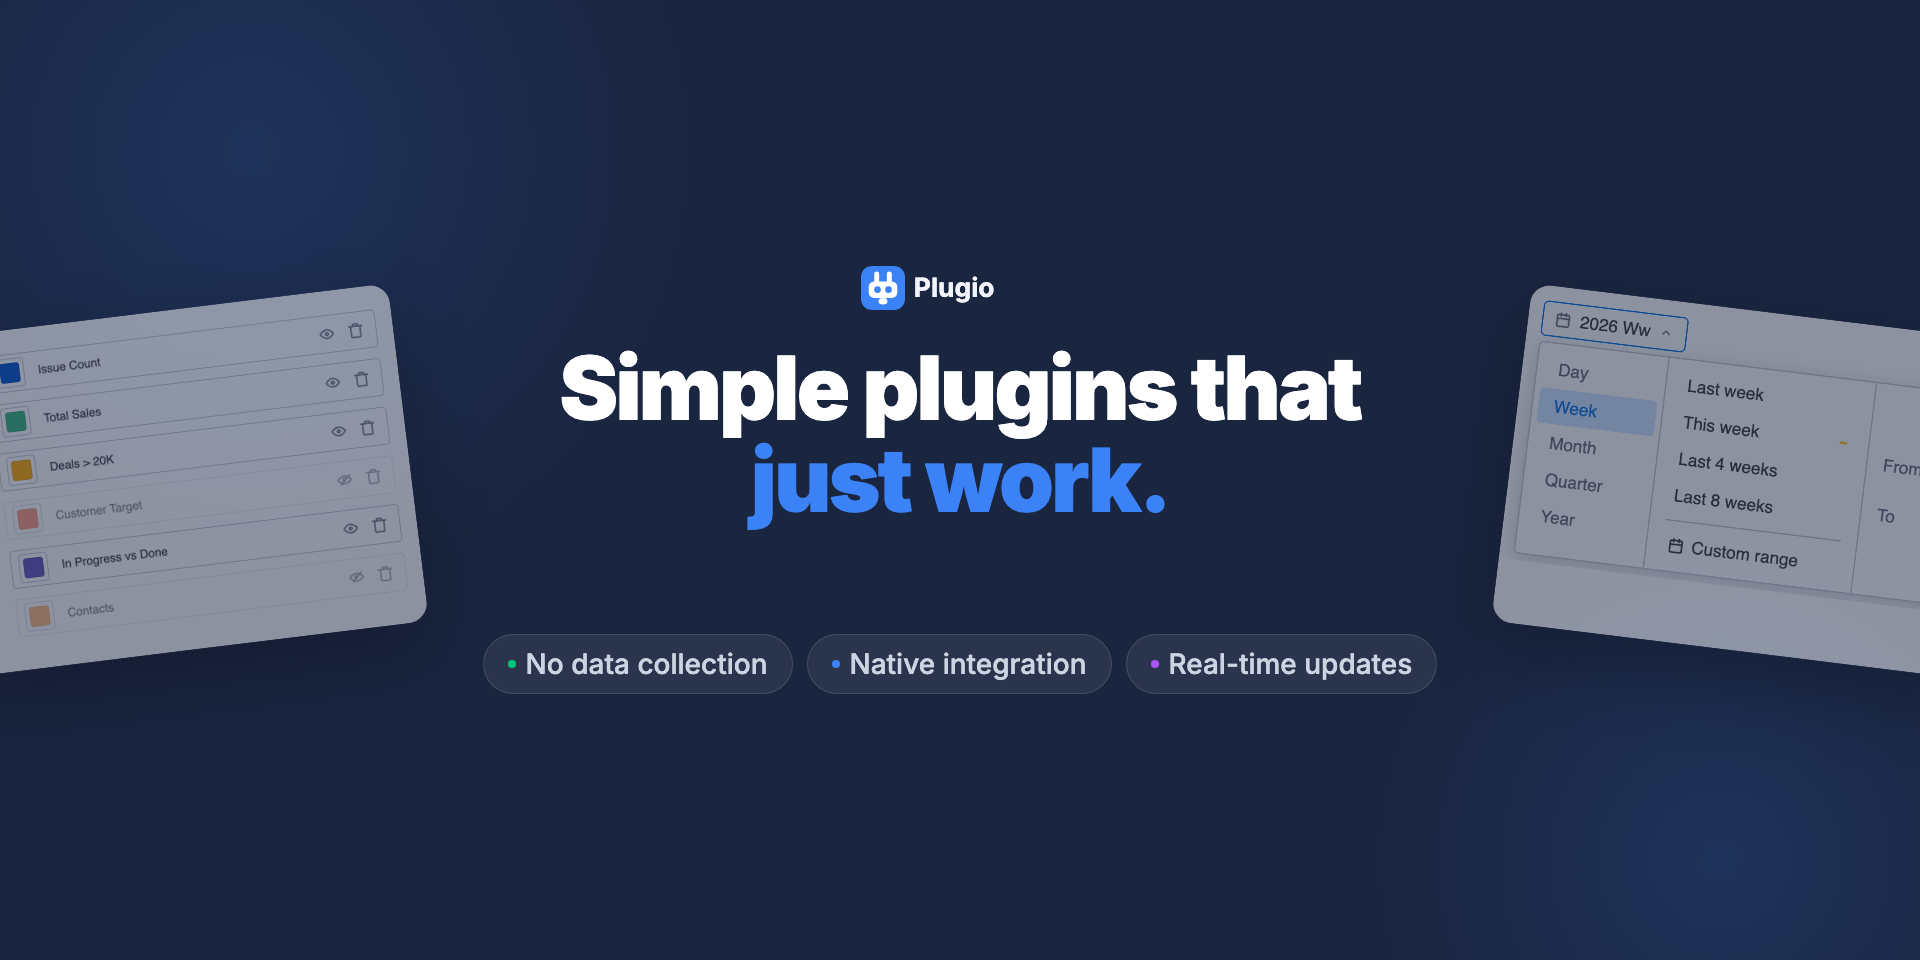
monday.com has your data. Metric Cards & KPI Dashboard puts it on display — as live, configurable cards your whole team can act on.
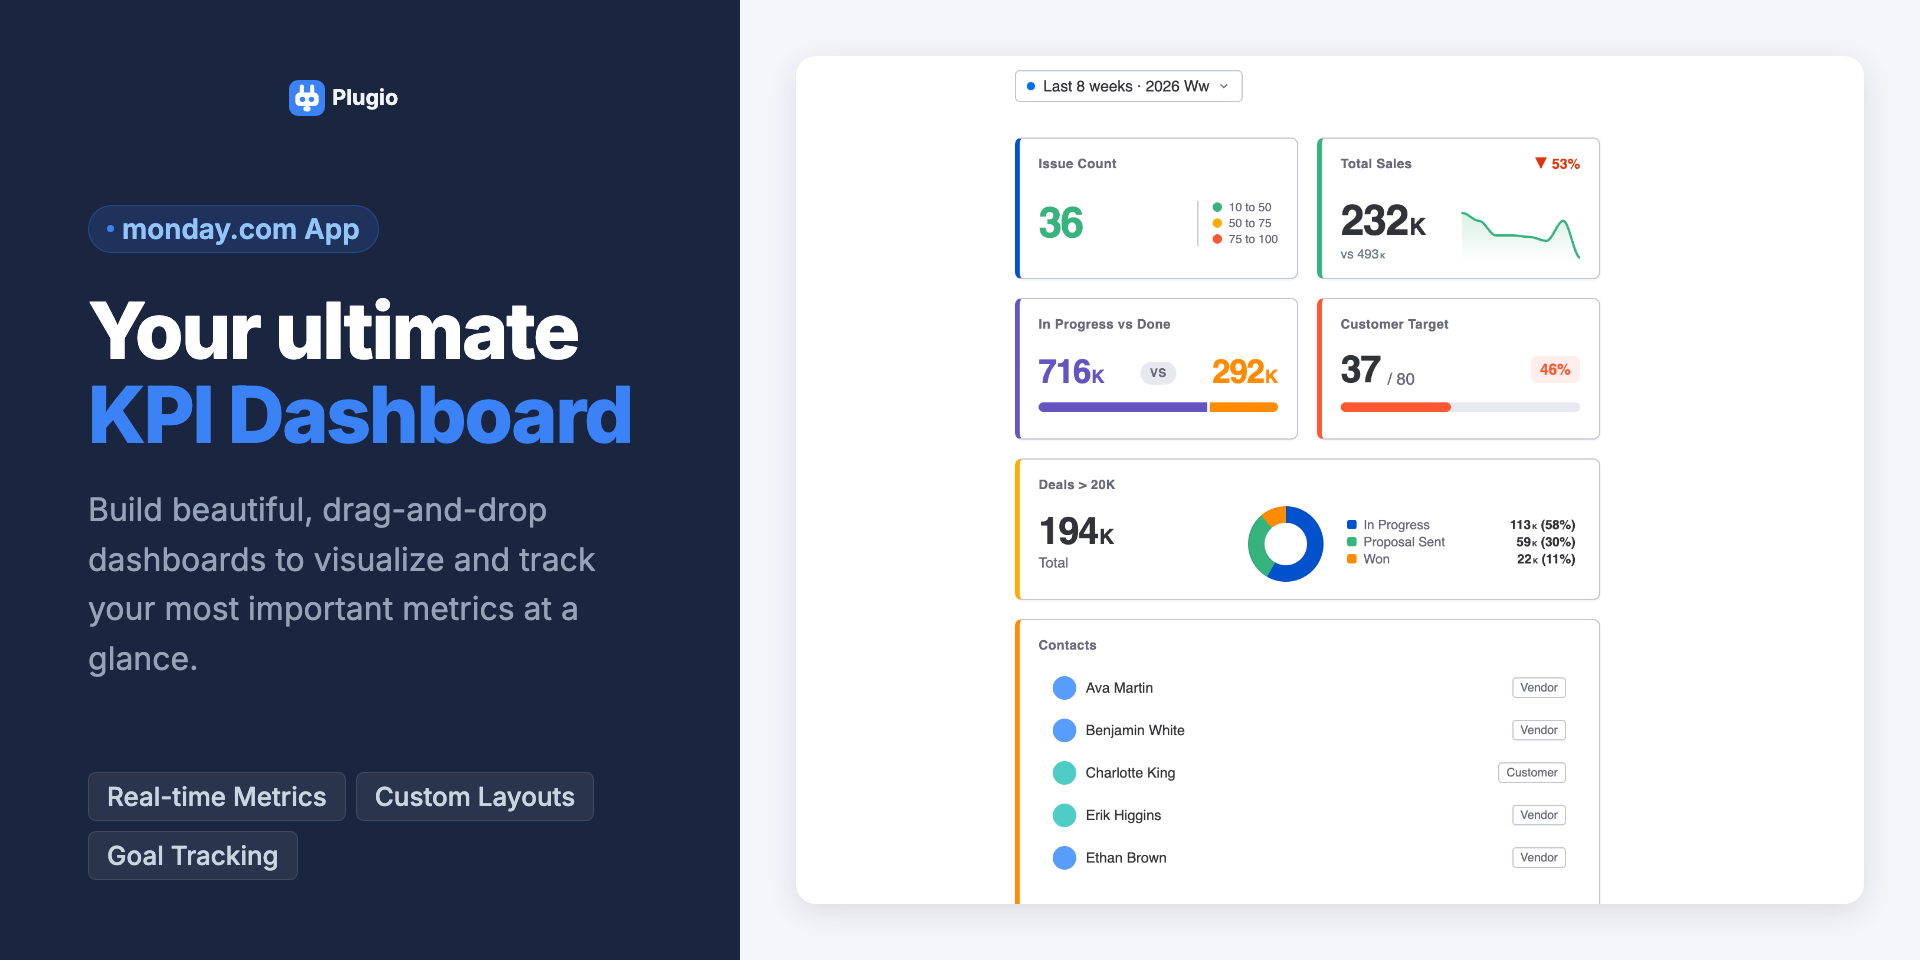
6 Card Types, Zero Compromises:
📊 Basic Metric — Count, sum, or average any column as a clean single-value card with color-range thresholds.
📈 Trend Analysis — Visualize momentum with sparklines and automatic period-over-period delta.
🎯 Progress Tracker — Set fixed or column-based targets and watch progress bars fill in real time.
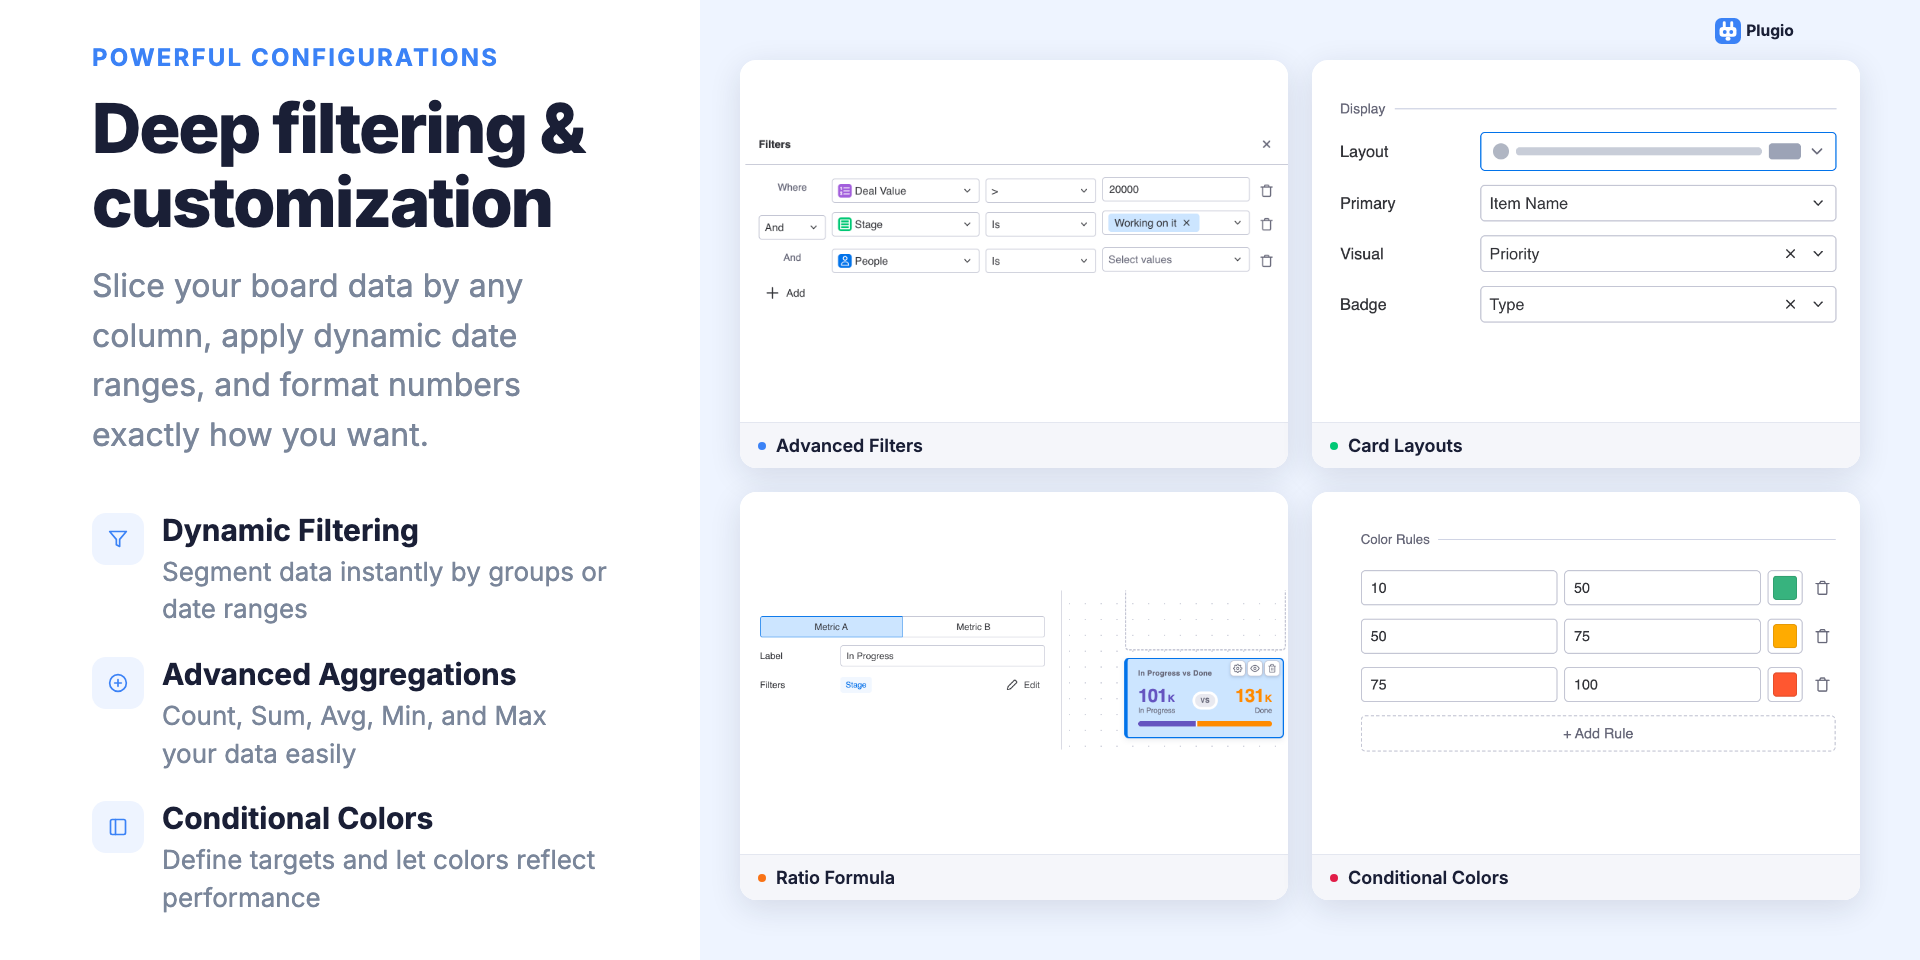
⚖️ Ratio Comparison — Compare two independent metrics side-by-side with separate filters for each.
🍩 Distribution Chart — Split data by status, group, or any column to see proportions at a glance.
🗂️ Item List — Surface critical items with custom sorting and 6 configurable row layout presets.
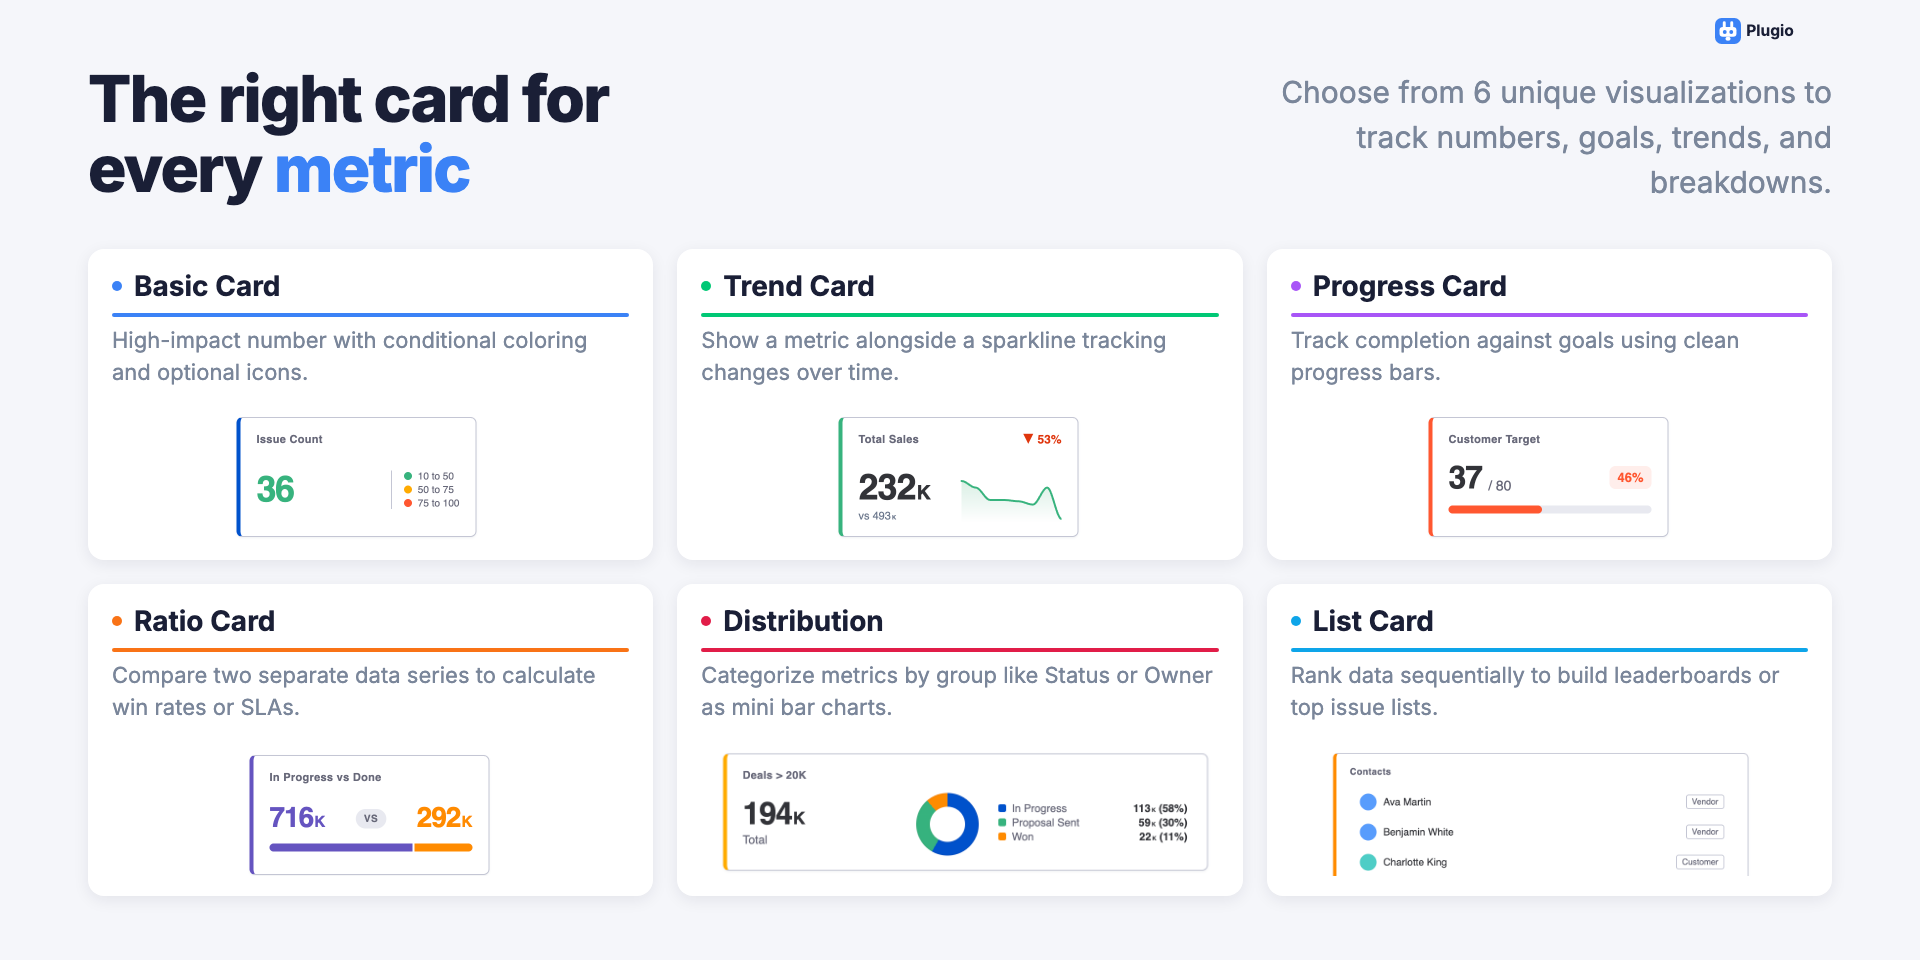
Powerful by Default:
⏱ Period Picker — Day, week, month, quarter, or year. Automatically compare any period to the previous one.
🔍 Flexible Filters — Combine AND/OR filter rules per card with full support for all monday.com column types.
🎨 Drag & Drop Grid — Arrange cards freely in a customizable grid up to 8×8.
🌗 Native Theming — Fully adapts to monday.com Light, Dark, Black, and Hacker themes.
🚀 Zero Config to Start — Add to your dashboard, pick a board and column, done in seconds.
Security & Compliance
Security
Does the developer periodically perform penetration testing?
Not answered
Does the developer have a dedicated security and privacy point of contact for such issues or questions?
Not answered
Does the app restrict redirects and forwards only to approved destinations, or show a warning when redirecting to potentially untrusted content?
Not answered
Does the app protect against mass parameter assignment attacks?
Not answered
Does the app perform encoding and sanitization on all user supplied parameters to protect against Cross-Site Scripting?
Not answered
Does the developer protect all state-changing actions against Cross-Site Request Forgery (CSRF)?
Not answered
Does the developer have mechanisms to notify monday.com in case of a security breach?
Not answered
Does this developer have a process for installing application-level updates and security patches for the service (such as software packages and databases)?
Not answered
Compliance
Is the app certified with the information security standard ISO/IEC 27001:2022?
Not answered
Is the app compliant with the Health Insurance Portability and Accountability Act (HIPAA)?
Not answered
Is the app certified with System and Organization Controls (SOC 2 or SOC 3)?
Not answered
Is the app compliant with the General Data Protection Regulation (GDPR)?
Not answered
Data
Does the app send any data outside of monday.com? If yes, indicate whether the data is customer-submitted (e.g., board names, item names, doc content) or non-customer-submitted (e.g., account ID, board ID, user ID).
No
Where does the app store logs data?
monday
No customer data is stored
Where does the app store the app data?
monday
No data is stored
Does the developer ensure application logs do not contain secrets or personally-identifiable information (PII)?
Yes
Is customer data segregated from the data of other customers (for example logically or physically)?
Yes
No customer data is stored
Privacy
Does the developer enforce multi-factor authentication on employees access to systems which may process customer data?
Not answered
Does the developer protect access to customer data based on the principle of least privilege?
Yes
Reviews
No reviews yet.
Historical data
Installation history
We have data for December 28, 2024 onwards only. Collected sometime after 00:00 UTC daily.
Total number of installs
Change in total number of installs in last 1 day(s)
Compares the number of installs on each date with 1 days previously:
Max
Min
Current
Change in total number of installs in last 7 day(s)
Compares the number of installs on each date with 7 days previously:
Max
Min
Current
Change in total number of installs in last 30 day(s)
Compares the number of installs on each date with 30 days previously:
Max
Min
Current
Change in total number of installs in last 90 day(s)
Compares the number of installs on each date with 90 days previously:
Max
Min
Current
Change in total number of installs in last 180 day(s)
Compares the number of installs on each date with 180 days previously:
Max
Min
Current
Ratings history
Categories history
Each of the following is a yes/no answer, so the graphs show 1 for yes, and 0 for no.