Pivot Tables
4 installs, since May 23, 2026. 1 installs/month. App updated May 19, 2026. Listing updated May 23, 2026.
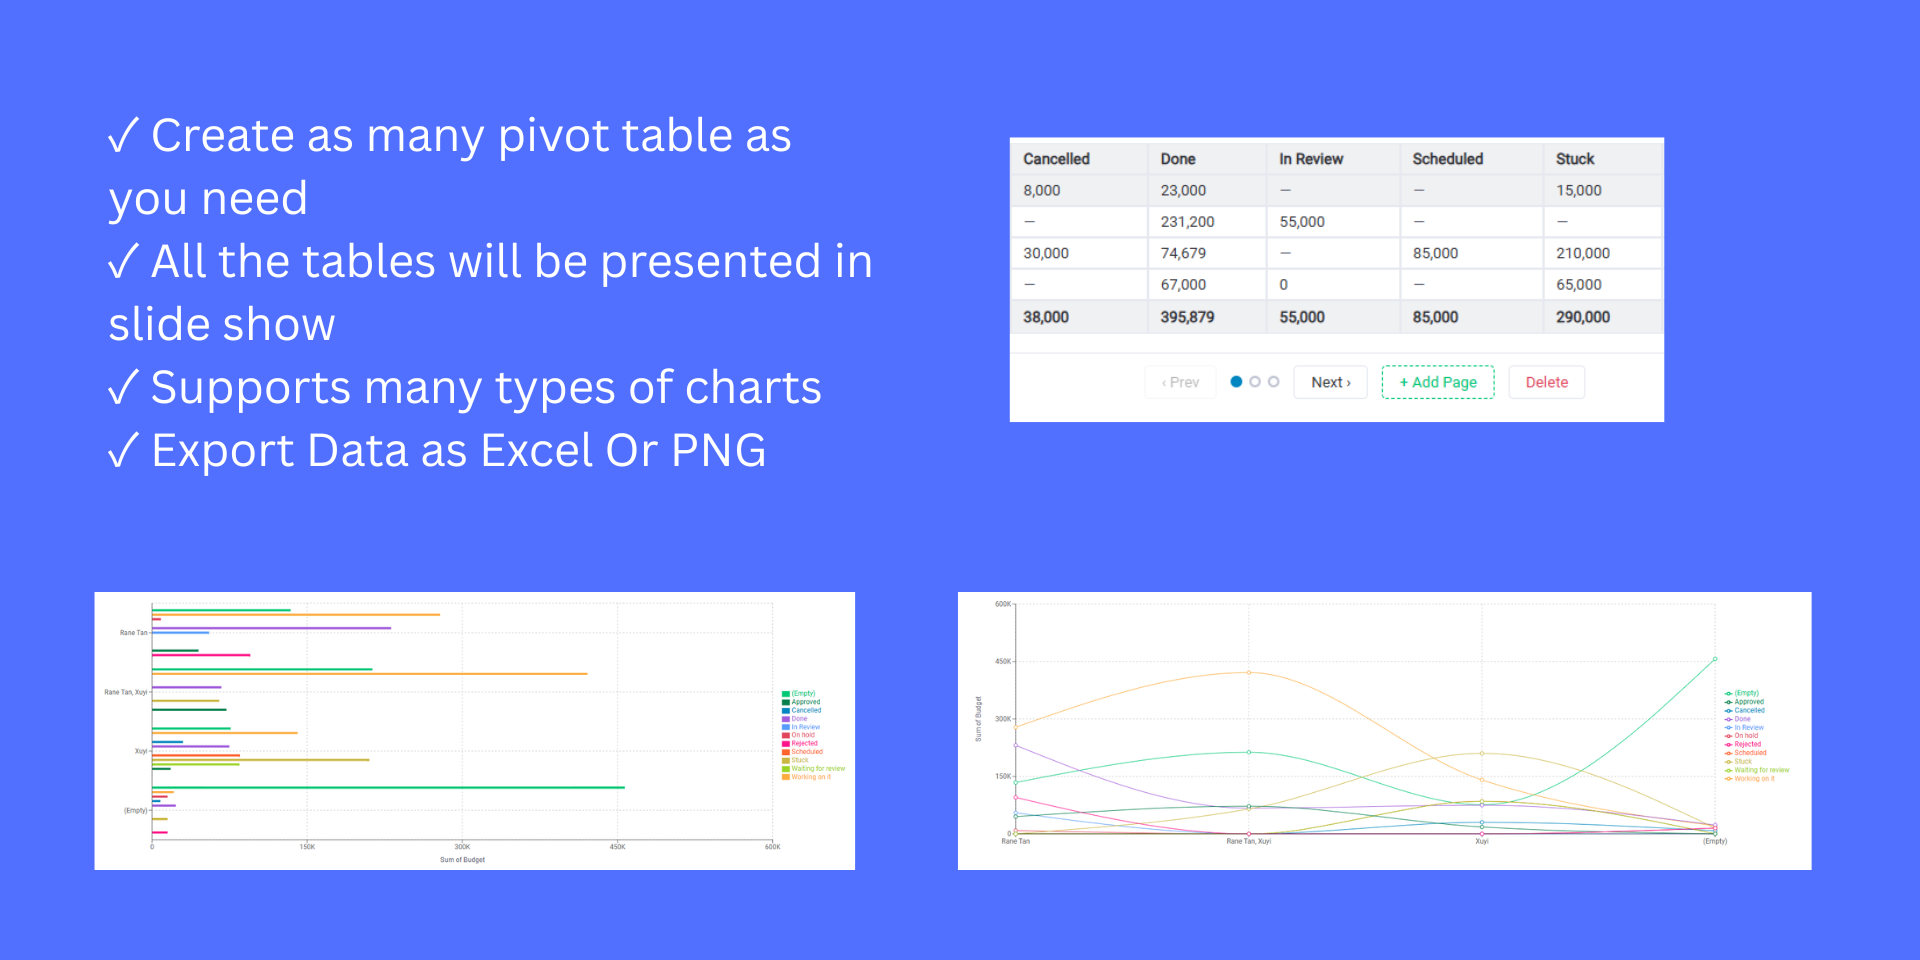
Pivot tables, charts, heatmaps & export for your board data.
Pivot Tables adds Excel-style pivot tables directly inside your monday.com board.
Summarize, aggregate, and cross-tabulate your board data in seconds. Answer questions like "total budget by client by status" or "task count per person per quarter" — right where your data lives, no exporting needed.
🎯 What problems does it solve?
- ⏱️ Exporting to Excel every week just to summarize board data wastes time and creates stale snapshots
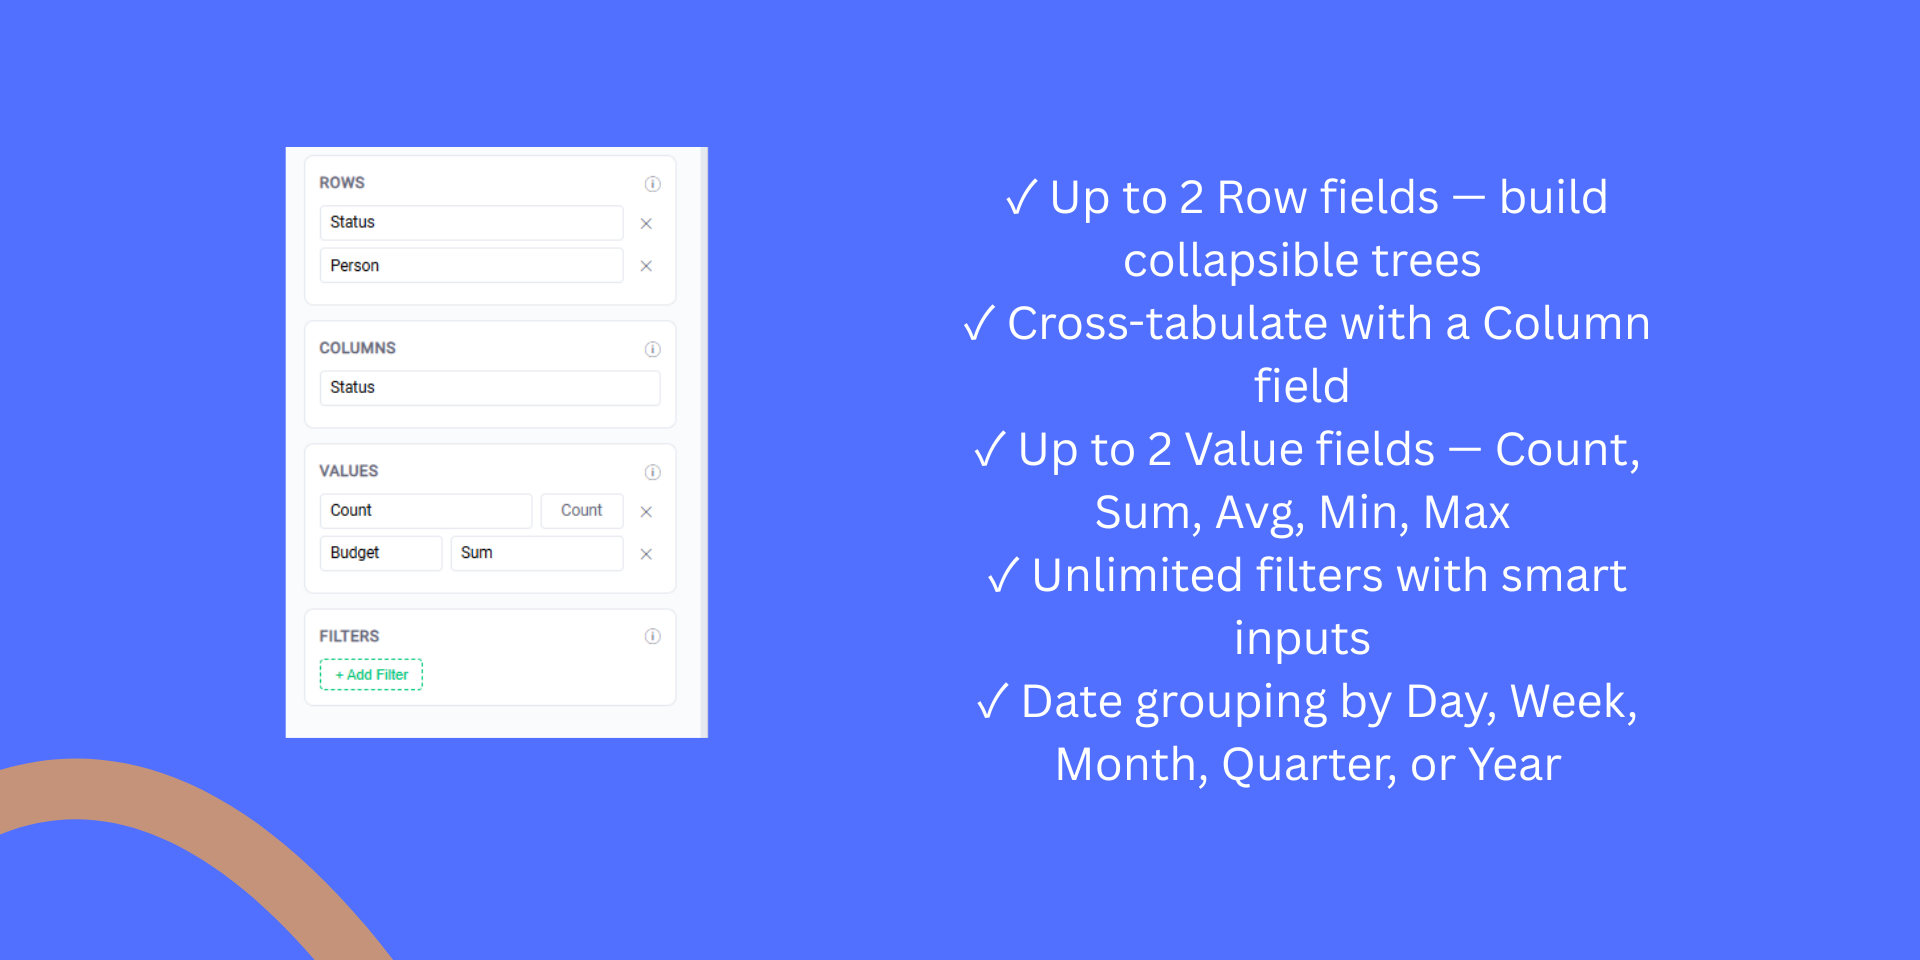
- 🔀 Subitems mixed with parent items create confusing, inaccurate pivot results — Pivot Tables keeps them cleanly separated
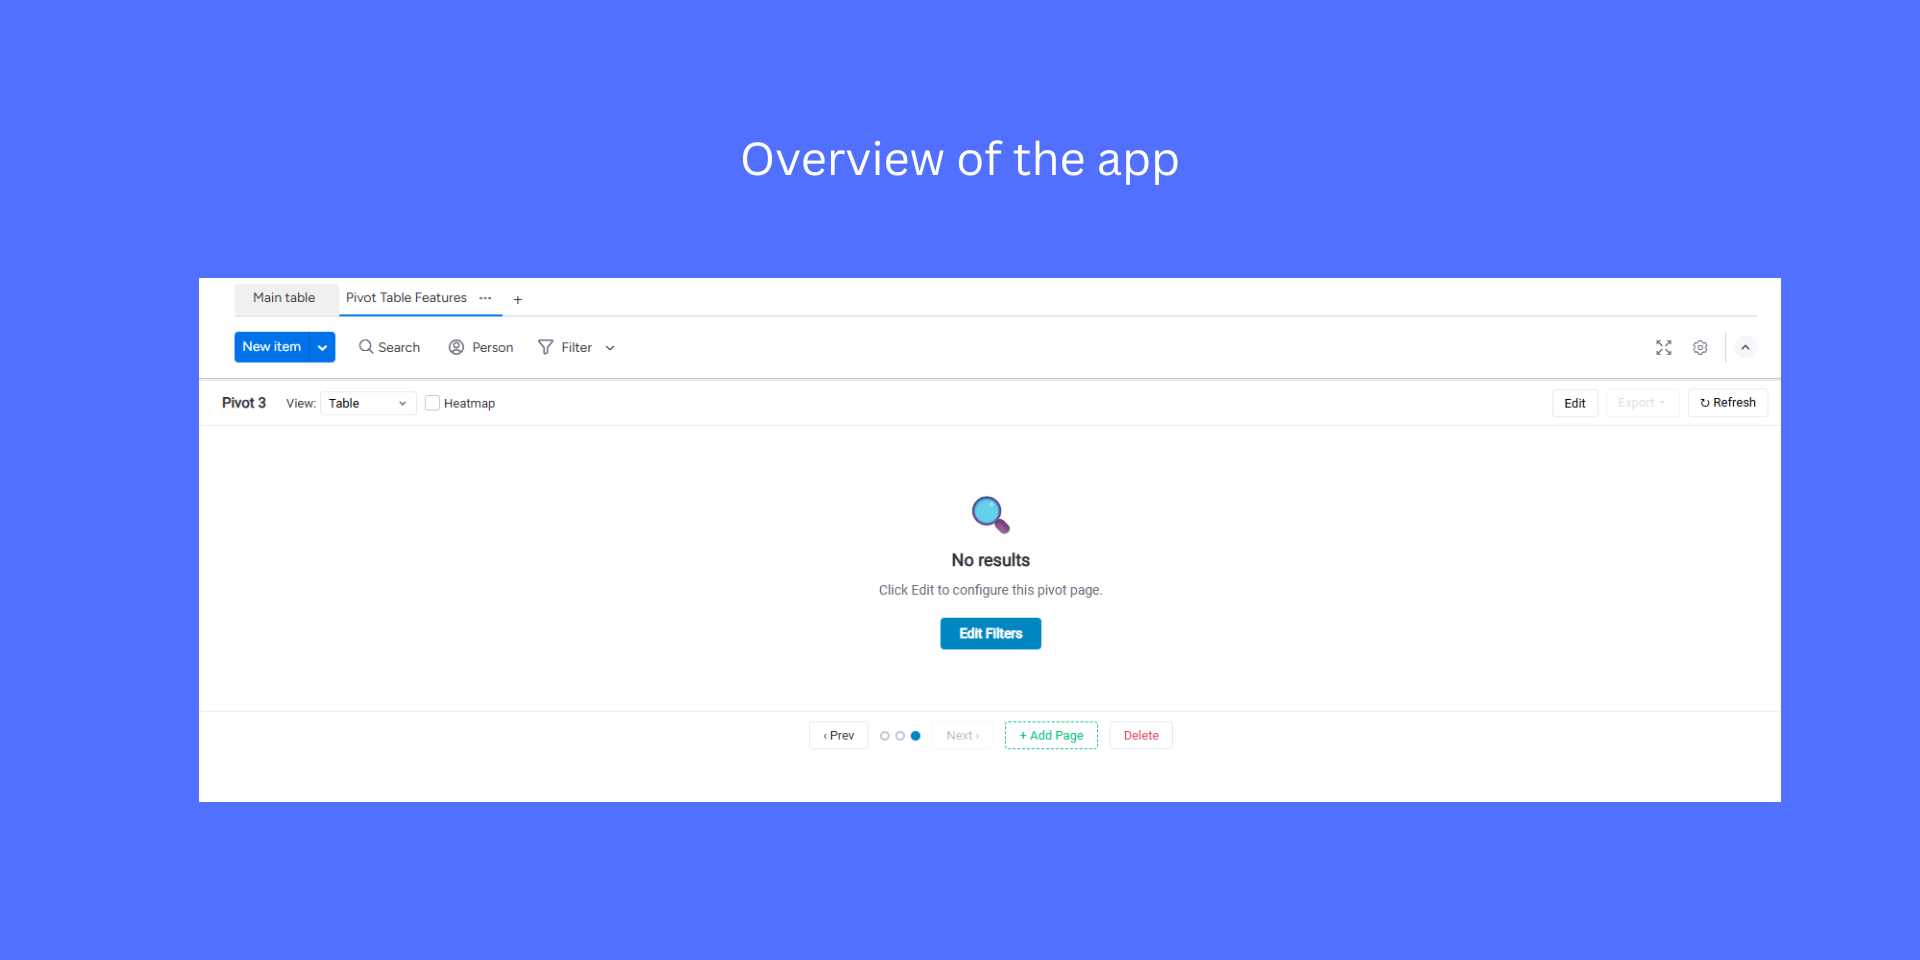
- 📊 Setting up reports shouldn't require a separate tool — get instant summaries as a board view
✨ Key Features:
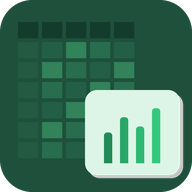
- 📈 6 Visualizations — Table, Heatmap, Bar Chart, Stacked Bar, Line Chart, and Pie Chart, all from the same configuration
- 📂 Items + Subitems modes — Pivot parent items or subitems independently with clean separation
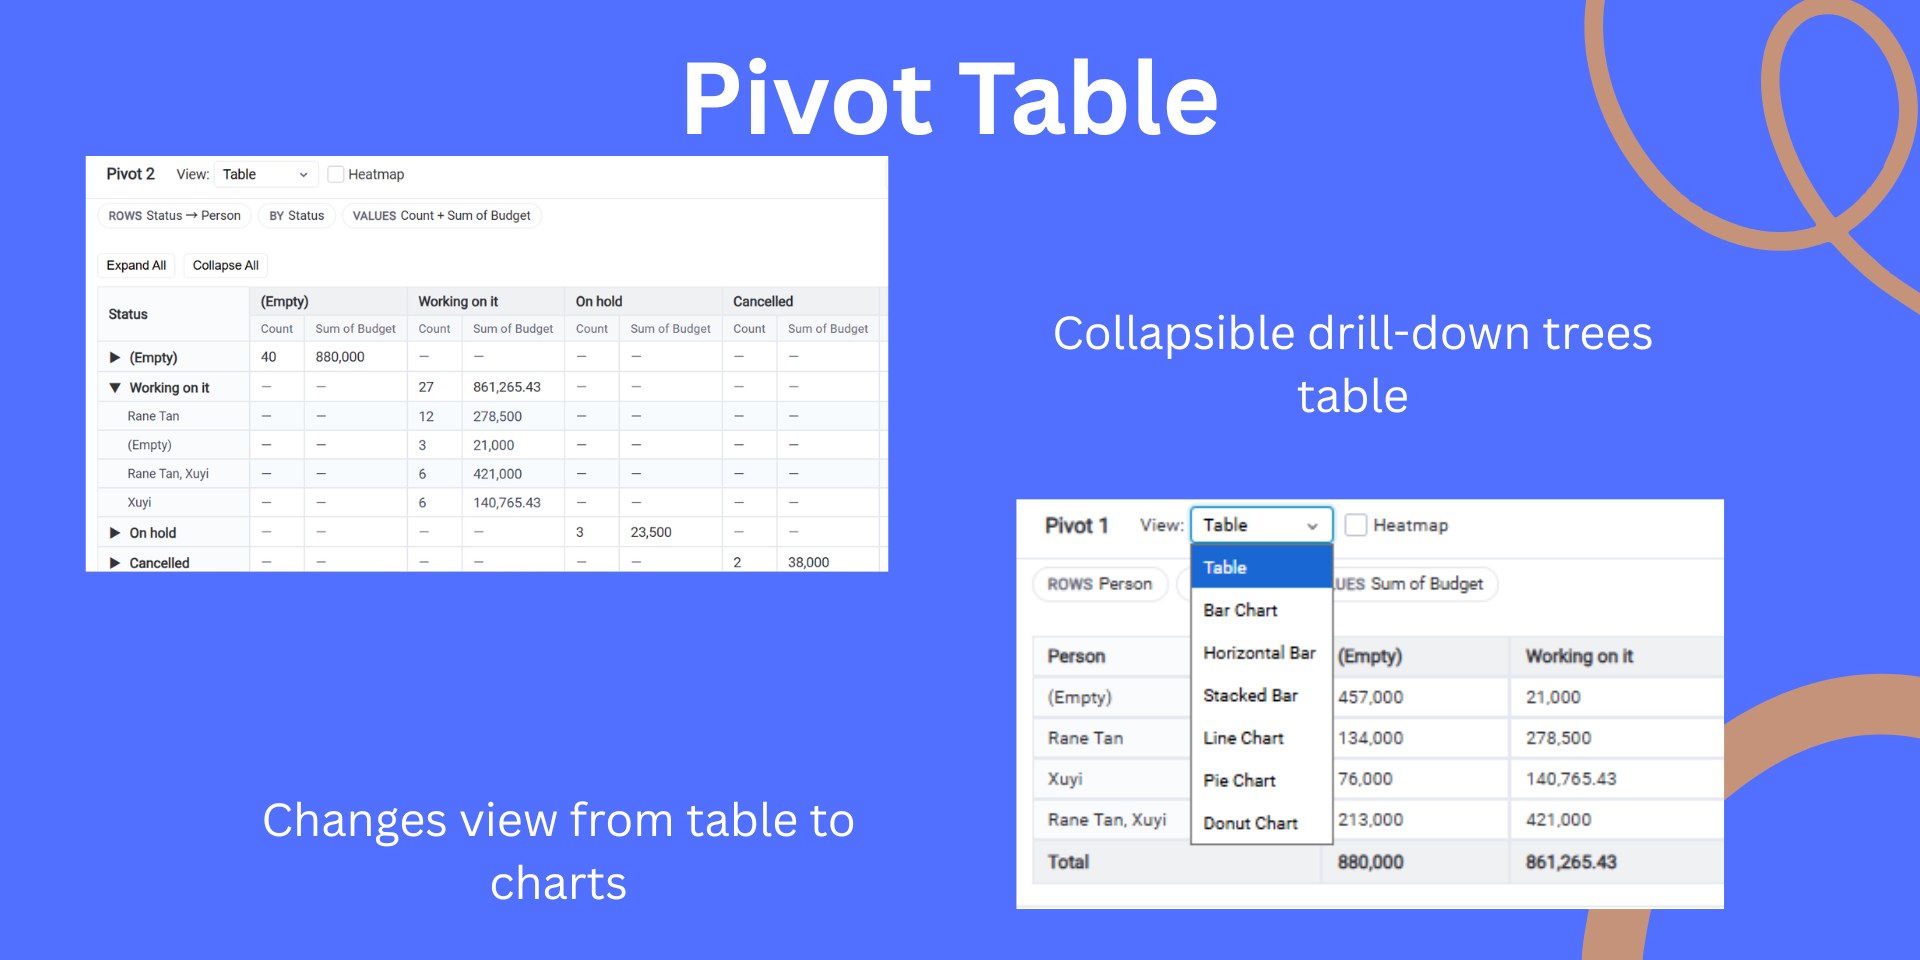
- 🔧 Flexible field wells — Up to 2 row fields (with collapsible tree view), 1 column field, and 2 value fields with independent aggregation (Sum, Count, Average, Min, Max, Median)
- 🔍 Powerful filters — Filter by status, person, dropdown, date, or number columns before pivoting. AND logic for multiple filters
- 📋 Group and parent item filtering — Narrow your data to specific board groups or specific parent items in subitems mode
- 📅 Date grouping — Group date columns by Day, Week, Month, Quarter, or Year
- 💾 Export — Download your pivot as Excel (.xlsx), CSV, or PNG image
- 📄 Multiple pages — Save different pivot configurations as pages and switch between them instantly (Pro)
- 🌡️ Heatmap overlay — Toggle color intensity on any table to spot patterns at a glance
💡 Example use cases:
- 👔 Project managers: "Show me total budget by client, broken down by status"
- 👥 Team leads: "How many tasks per person are stuck vs done this quarter?"
- ⚙️ Operations: "What's the average deal size by region per month?"
🔒 Privacy & Security:
Pivot Tables is 100% client-side. All data processing happens in your browser — nothing is sent to external servers. The app uses only monday.com's built-in Storage API to save your pivot configurations.
💰 Pricing:
- 🆓 Free — 1 pivot page with all features, no limits on items or columns
- ⭐ Pro ($4/seat/month) — Unlimited pivot pages
- 🕐 14-day free trial of Pro included
📧 Questions or feedback? Contact us at support@elephatech.com
Security & Compliance
The app developer did not provide the security and compliance information for this app.
Reviews
No reviews yet.
Historical data
Installation history
We have data for December 28, 2024 onwards only. Collected sometime after 00:00 UTC daily.
Total number of installs
Change in total number of installs in last 1 day(s)
Compares the number of installs on each date with 1 days previously:
Change in total number of installs in last 7 day(s)
Compares the number of installs on each date with 7 days previously:
Change in total number of installs in last 30 day(s)
Compares the number of installs on each date with 30 days previously:
Change in total number of installs in last 90 day(s)
Compares the number of installs on each date with 90 days previously:
Change in total number of installs in last 180 day(s)
Compares the number of installs on each date with 180 days previously:
Ratings history
Categories history
Each of the following is a yes/no answer, so the graphs show 1 for yes, and 0 for no.