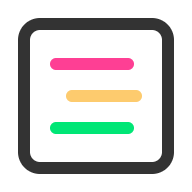
See retainer risk across clients before you exceed
What it does: Retainer Pulse is a dashboard widget that shows retainer health across all your client boards in one view. Built for agencies that track hours against monthly retainer caps in monday.com.
What you get:
Stop opening boards one by one to check hours. See every client's retainer status from a single dashboard
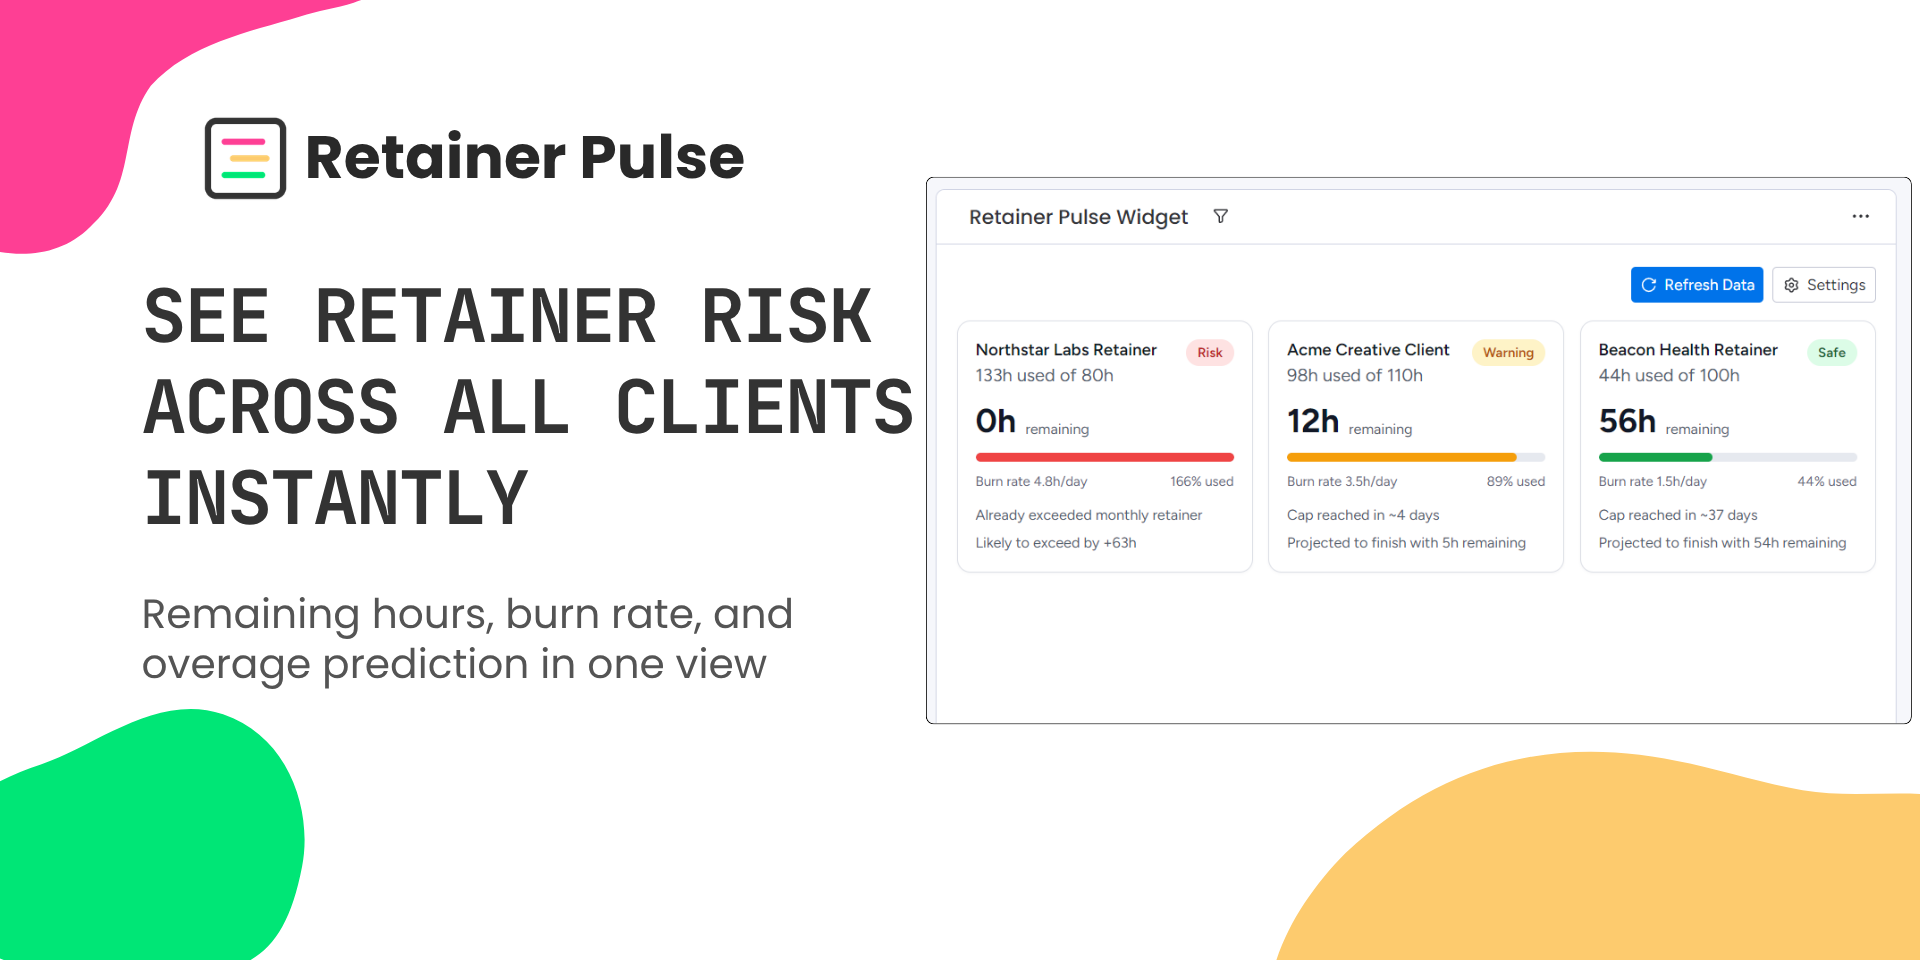
Catch overages before they happen with burn rate projections and overage predictions
Focus on what matters first. Cards are sorted by risk so at-risk clients are always at the top
Color-coded status (red/yellow/green) for instant 2-second reads
Use cases:
An account manager checking all 10 client retainers in the morning before standup
An ops lead spotting that a client will exceed their 80-hour cap in 5 days and reallocating work
A project manager noticing a client has 30 hours remaining with one week left and scheduling proactive work
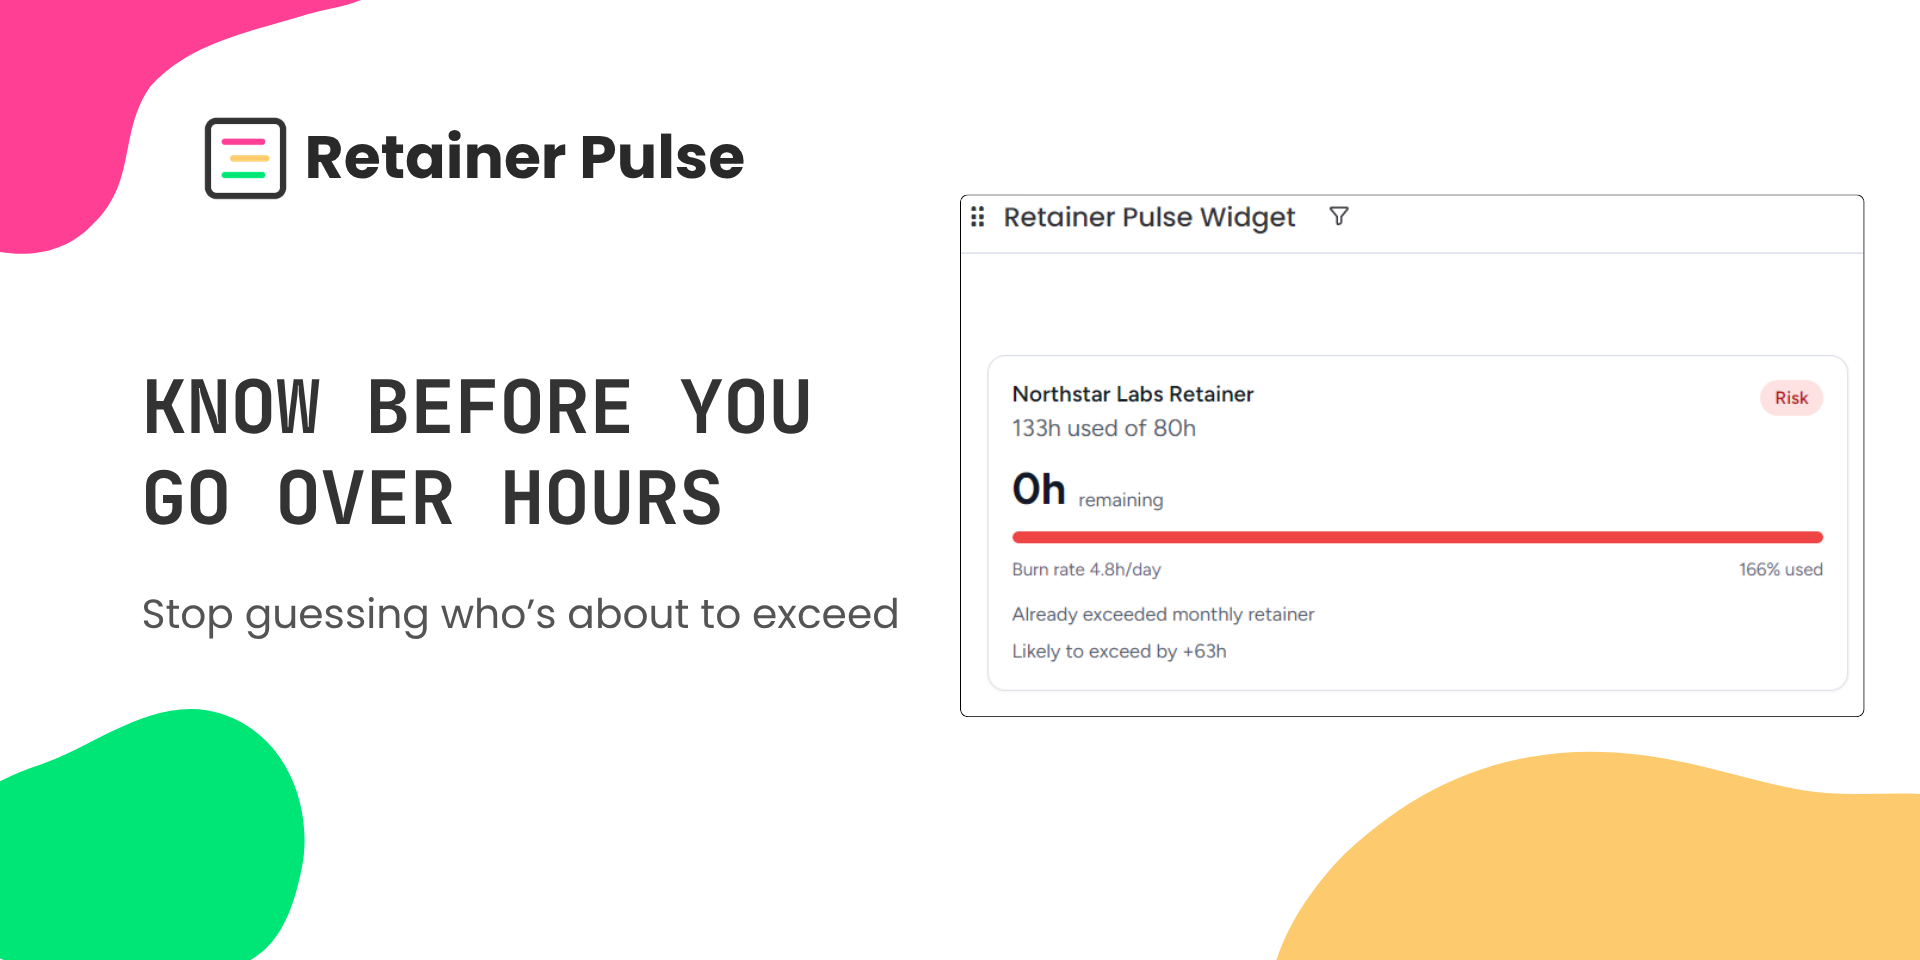
How it works: Add the widget to any dashboard, select your client boards, and map your hours and cap columns. No automations, no ongoing setup, configure once and check daily.
Get started: Install Retainer Pulse for free and add it to your dashboard in under a minute.
Security & Compliance
Security
Does the developer periodically perform penetration testing?
Not answered
Does the developer have a dedicated security and privacy point of contact for such issues or questions?
Yes
Security and privacy questions can be sent to https://elevixapps.com/support.html
Does the app restrict redirects and forwards only to approved destinations, or show a warning when redirecting to potentially untrusted content?
Yes
Retainer Pulse does not implement arbitrary redirects. The only external navigation opens a monday.com board URL derived from the current monday.com location and the selected board ID.
Does the app protect against mass parameter assignment attacks?
Yes
Retainer Pulse does not expose generic object update endpoints. Backend endpoints accept only limited requests, authenticate them with monday-signed JWTs, and use only expected fields for uninstall reset/status behavior.
Does the app perform encoding and sanitization on all user supplied parameters to protect against Cross-Site Scripting?
Yes
Retainer Pulse sanitizes monday/user-derived text with DOMPurify before displaying or storing relevant values, and the code does not use dangerouslySetInnerHTML.
Does the developer protect all state-changing actions against Cross-Site Request Forgery (CSRF)?
Yes
Retainer Pulse does not use cookie-based authentication for backend state-changing actions. Backend requests are authenticated with monday-signed bearer JWTs, and unauthenticated requests are rejected.
Does the developer have mechanisms to notify monday.com in case of a security breach?
Not answered
Does this developer have a process for installing application-level updates and security patches for the service (such as software packages and databases)?
Yes
The developer reviews dependency and platform updates, applies security patches as needed, tests changes, and deploys updated frontend/backend code through the monday app deployment tooling.
Compliance
Is the app certified with the information security standard ISO/IEC 27001:2022?
No
Retainer Pulse is not currently certified under ISO/IEC 27001:2022.
Is the app compliant with the Health Insurance Portability and Accountability Act (HIPAA)?
No
Retainer Pulse is not intended for HIPAA-regulated protected health information and is not currently offered as a HIPAA-compliant application.
Is the app certified with System and Organization Controls (SOC 2 or SOC 3)?
No
Retainer Pulse does not currently have a SOC 2 or SOC 3 report.
Is the app compliant with the General Data Protection Regulation (GDPR)?
Not answered
Data
Does the app send any data outside of monday.com? If yes, indicate whether the data is customer-submitted (e.g., board names, item names, doc content) or non-customer-submitted (e.g., account ID, board ID, user ID).
No
Retainer Pulse does not send customer-submitted board or item data outside monday.com. The app reads connected board data through the monday SDK/API and stores configuration in monday storage. The only backend request is a monday session-token-authenticated storage reset status check; when hosted on monday infrastructure, this remains within monday.com.
Where does the app store logs data?
monday
Application logs are generated by the app runtime/hosting environment. Retainer Pulse does not implement a separate external log storage service in the application code.
Where does the app store the app data?
monday
Retainer Pulse stores widget configuration in monday.com instance storage, including selected board IDs, board names, monthly cap, usage column IDs, and optional date column ID. It also stores uninstall reset markers in monday SecureStorage, scoped by account ID.
Does the developer ensure application logs do not contain secrets or personally-identifiable information (PII)?
Yes
The application does not intentionally log secrets, tokens, or customer-submitted board/item content. The code logs operational events and errors only; session tokens and the monday client secret are not logged.
Is customer data segregated from the data of other customers (for example logically or physically)?
Yes
App configuration is stored in monday instance storage and uninstall reset markers are stored in monday SecureStorage using account-scoped keys. The app does not maintain a shared external customer database.
Privacy
Does the developer enforce multi-factor authentication on employees access to systems which may process customer data?
Not answered
Does the developer protect access to customer data based on the principle of least privilege?
Yes
Retainer Pulse requests and uses only the monday.com data needed to provide retainer usage reporting for connected boards. Access is limited by the installing user's monday.com permissions, and the app does not maintain a separate external customer database.
Reviews
No reviews yet.
Historical data
Installation history
We have data for December 28, 2024 onwards only. Collected sometime after 00:00 UTC daily.
Total number of installs
Change in total number of installs in last 1 day(s)
Compares the number of installs on each date with 1 days previously:
Max
Min
Current
Change in total number of installs in last 7 day(s)
Compares the number of installs on each date with 7 days previously:
Max
Min
Current
Change in total number of installs in last 30 day(s)
Compares the number of installs on each date with 30 days previously:
Max
Min
Current
Change in total number of installs in last 90 day(s)
Compares the number of installs on each date with 90 days previously:
Max
Min
Current
Change in total number of installs in last 180 day(s)
Compares the number of installs on each date with 180 days previously:
Max
Min
Current
Ratings history
Categories history
Each of the following is a yes/no answer, so the graphs show 1 for yes, and 0 for no.
{
"id": 10001157,
"marketplace_developer_id": 100000218,
"app_id": 11079983,
"app_type": "app",
"security_info": {},
"gallery_assets": [
{
"url": "https://cdn.monday.com/marketplace/10001157/10001157_2026_3_30_10_27_29_ues7kv7.png",
"type": "image"
},
{
"url": "https://cdn.monday.com/marketplace/10001157/10001157_2026_3_30_10_27_34_x9yphtog.png",
"type": "image"
},
{
"url": "https://cdn.monday.com/marketplace/10001157/10001157_2026_3_30_10_27_39_epkmnaxi.png",
"type": "image"
},
{
"url": "https://cdn.monday.com/marketplace/10001157/10001157_2026_3_30_10_27_44_jtrm30a.png",
"type": "image"
},
{
"url": "https://cdn.monday.com/marketplace/10001157/10001157_2026_4_11_21_41_12_s92wdow.mp4",
"type": "video"
}
],
"description": "<p><strong>What it does:</strong> Retainer Pulse is a dashboard widget that shows retainer health across all your client boards in one view. Built for agencies that track hours against monthly retainer caps in monday.com.</p><p><strong>What you get:</strong></p><ul><li>Stop opening boards one by one to check hours. See every client's retainer status from a single dashboard</li><li>Catch overages before they happen with burn rate projections and overage predictions</li><li>Focus on what matters first. Cards are sorted by risk so at-risk clients are always at the top</li><li>Color-coded status (red/yellow/green) for instant 2-second reads</li></ul><p><strong>Use cases:</strong></p><ul><li>An account manager checking all 10 client retainers in the morning before standup</li><li>An ops lead spotting that a client will exceed their 80-hour cap in 5 days and reallocating work</li><li>A project manager noticing a client has 30 hours remaining with one week left and scheduling proactive work</li></ul><p><strong>How it works:</strong> Add the widget to any dashboard, select your client boards, and map your hours and cap columns. No automations, no ongoing setup, configure once and check daily.</p><p><strong>Get started:</strong> Install Retainer Pulse for free and add it to your dashboard in under a minute.</p>",
"short_description": "See retainer risk across clients before you exceed",
"thumbnail_url": "https://cdn.monday.com/marketplace/10001157/10001157_2026_3_30_10_26_45_6pdvk37j.jpg",
"logo_url": "https://cdn.monday.com/marketplace/10001157/10001157_2026_3_30_10_26_19_ib995cd.png",
"feedback_url": "https://elevixapps.com/support.html",
"privacy_policy_url": "https://elevixapps.com/privacy.html",
"featured": false,
"name": "Retainer Pulse",
"how_to_use_url": "https://elevixapps.com/docs/getting-started.html",
"external_pricing_url": null,
"keywords": "retainer,retainer tracking,hours tracking,time tracking,agency,client management,dashboard,burn rate,overage,project management",
"compliance_answers": [
{
"questionId": 20,
"shortAnswer": false,
"detailedAnswer": "Retainer Pulse is not currently certified under ISO/IEC 27001:2022.\n"
},
{
"questionId": 19,
"shortAnswer": false,
"detailedAnswer": "Retainer Pulse does not send customer-submitted board or item data outside monday.com. The app reads connected board data through the monday SDK/API and stores configuration in monday storage. The only backend request is a monday session-token-authenticated storage reset status check; when hosted on monday infrastructure, this remains within monday.com.\n"
},
{
"questionId": 18,
"detailedAnswer": "Application logs are generated by the app runtime/hosting environment. Retainer Pulse does not implement a separate external log storage service in the application code.\n",
"logHostingProvider": "monday"
},
{
"questionId": 17,
"detailedAnswer": "Retainer Pulse stores widget configuration in monday.com instance storage, including selected board IDs, board names, monthly cap, usage column IDs, and optional date column ID. It also stores uninstall reset markers in monday SecureStorage, scoped by account ID.\n",
"dataHostingProvider": "monday"
},
{
"questionId": 14,
"shortAnswer": true,
"detailedAnswer": "Security and privacy questions can be sent to \nhttps://elevixapps.com/support.html"
},
{
"questionId": 13,
"shortAnswer": false,
"detailedAnswer": "Retainer Pulse is not intended for HIPAA-regulated protected health information and is not currently offered as a HIPAA-compliant application.\n"
},
{
"questionId": 12,
"shortAnswer": false,
"detailedAnswer": "Retainer Pulse does not currently have a SOC 2 or SOC 3 report.\n"
},
{
"questionId": 10,
"shortAnswer": true,
"detailedAnswer": "Retainer Pulse does not implement arbitrary redirects. The only external navigation opens a monday.com board URL derived from the current monday.com location and the selected board ID.\n"
},
{
"questionId": 9,
"shortAnswer": true,
"detailedAnswer": "Retainer Pulse does not expose generic object update endpoints. Backend endpoints accept only limited requests, authenticate them with monday-signed JWTs, and use only expected fields for uninstall reset/status behavior.\n"
},
{
"questionId": 8,
"shortAnswer": true,
"detailedAnswer": "The application does not intentionally log secrets, tokens, or customer-submitted board/item content. The code logs operational events and errors only; session tokens and the monday client secret are not logged.\n"
},
{
"questionId": 6,
"shortAnswer": true,
"detailedAnswer": "Retainer Pulse requests and uses only the monday.com data needed to provide retainer usage reporting for connected boards. Access is limited by the installing user's monday.com permissions, and the app does not maintain a separate external customer database.\n"
},
{
"questionId": 5,
"shortAnswer": true,
"detailedAnswer": "Retainer Pulse sanitizes monday/user-derived text with DOMPurify before displaying or storing relevant values, and the code does not use dangerouslySetInnerHTML."
},
{
"questionId": 4,
"shortAnswer": true,
"detailedAnswer": "Retainer Pulse does not use cookie-based authentication for backend state-changing actions. Backend requests are authenticated with monday-signed bearer JWTs, and unauthenticated requests are rejected.\n"
},
{
"questionId": 2,
"shortAnswer": true,
"detailedAnswer": "The developer reviews dependency and platform updates, applies security patches as needed, tests changes, and deploys updated frontend/backend code through the monday app deployment tooling."
},
{
"questionId": 1,
"shortAnswer": true,
"detailedAnswer": "App configuration is stored in monday instance storage and uninstall reset markers are stored in monday SecureStorage using account-scoped keys. The app does not maintain a shared external customer database."
}
],
"created_at": "2026-04-30T10:25:49.000Z",
"updated_at": "2026-05-13T17:47:40.000Z",
"automation_app_id": null,
"marketplace_category_ids": [
10000001,
9,
6
],
"pinned_for_categories_ids": [],
"featured_for_categories_ids": [],
"pricing_data": null,
"label": null,
"app_values": [
"Easier resource management"
],
"security": true,
"display_in_template_store": false,
"acquisition_source": "No touch",
"is_connector": false,
"show_connections": null,
"terms_of_service_url": "https://elevixapps.com/terms.html",
"available_for_tiers": [],
"available_for_products": [],
"google_analytics_tag_id": "G-LNWMK42ZVC",
"is_solution": false,
"cta_override": null,
"app_scope_str": "boards:read",
"app_client_id": "241026ae3fbd233ae319436ccefddd3f",
"app_color": {
"hsl": {
"h": 155.1,
"s": 0,
"l": 0.2,
"a": 1
},
"hex": "#333333",
"rgb": {
"r": 51,
"g": 51,
"b": 51,
"a": 1
},
"hsv": {
"h": 155.1,
"s": 0,
"v": 0.2,
"a": 1
},
"oldHue": 155.1,
"source": "hex"
},
"plans": [
{
"id": "11079983-1-free",
"appPlanId": "free",
"name": "Free",
"versionId": 1,
"isTrial": false,
"prices": {
"type": "standard",
"monthly": 0,
"yearly": 0
},
"versionState": "live",
"appId": 11079983,
"description": "See retainer usage across all your client boards in seconds",
"extraData": {
"bullets": [
"Track hours used and remaining across all clients",
"See retainer health with clear risk status",
"Multi-board view in a single dashboard widget",
"Identify at-risk clients instantly",
"Fast setup with your existing boards"
],
"monthlyFee": 0,
"yearlyFee": 0
},
"isFree": true,
"isRecommended": false,
"currency": "USD"
}
],
"app_live_version": {
"updated_at": "2026-05-11T15:38:09.555Z",
"id": 14581582
},
"pricing_model": null,
"monetization": {
"monetizationType": "monday",
"hasFreePlan": true,
"hasPaidPlan": false,
"hasTrialPlan": false
},
"badges_data": {
"security": true,
"app_values": [
"Easier resource management"
],
"acquisition_source": "No touch",
"display_in_template_store": false
},
"data": {
"is_solution": false,
"cta_override": null,
"is_connector": false,
"available_for_tiers": [],
"terms_of_service_url": "https://elevixapps.com/terms.html",
"available_for_products": [],
"google_analytics_tag_id": "G-LNWMK42ZVC"
},
"display": null,
"installsDelta": {
"totalInstalls": 4,
"sevenDays": 0,
"thirtyDays": 1,
"ninetyDays": 2
}
}