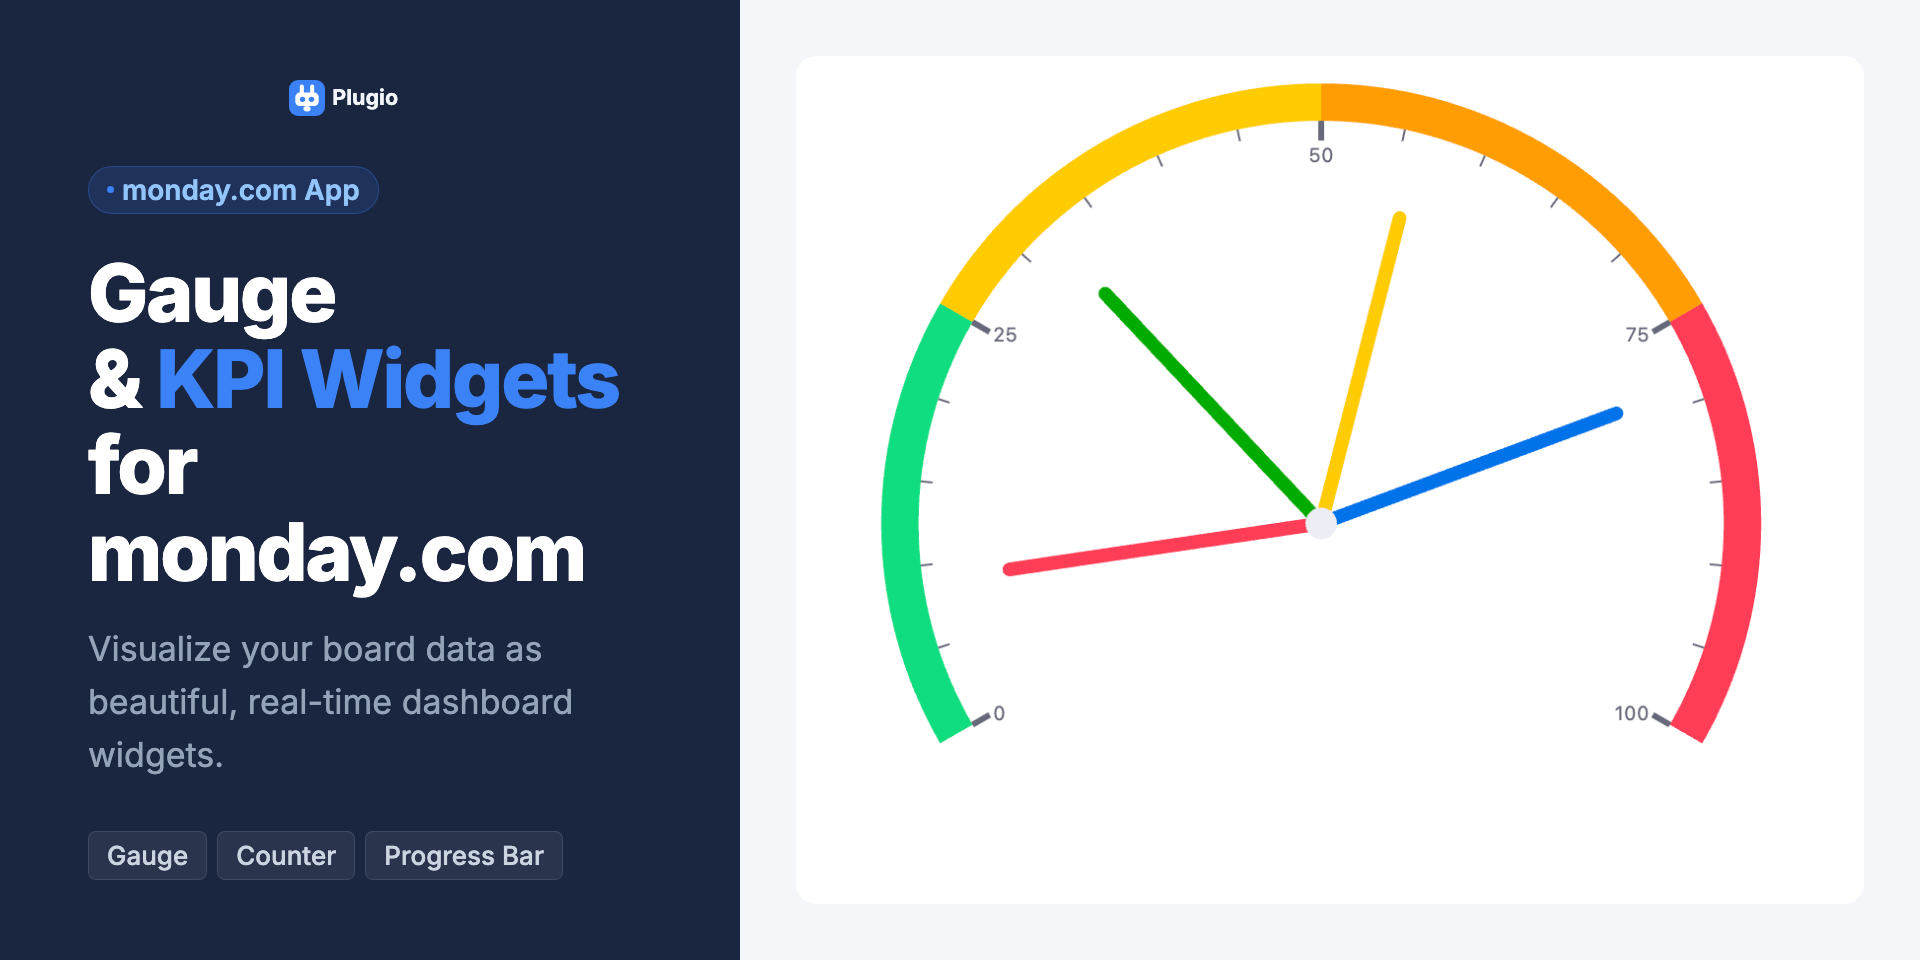
Plugio Gauge & KPI Widgets brings powerful data visualization directly to your monday.com dashboards — no external tools, no exports, no complexity. Built for teams who need clear, real-time metrics without ever leaving monday.com.
What problems does it solve?
Most monday.com users track numbers in board columns but have no way to instantly see whether a metric is on track, at risk, or critical — without manually checking rows or exporting to spreadsheets. Plugio Gauge fixes that directly on your dashboard.
What you get:
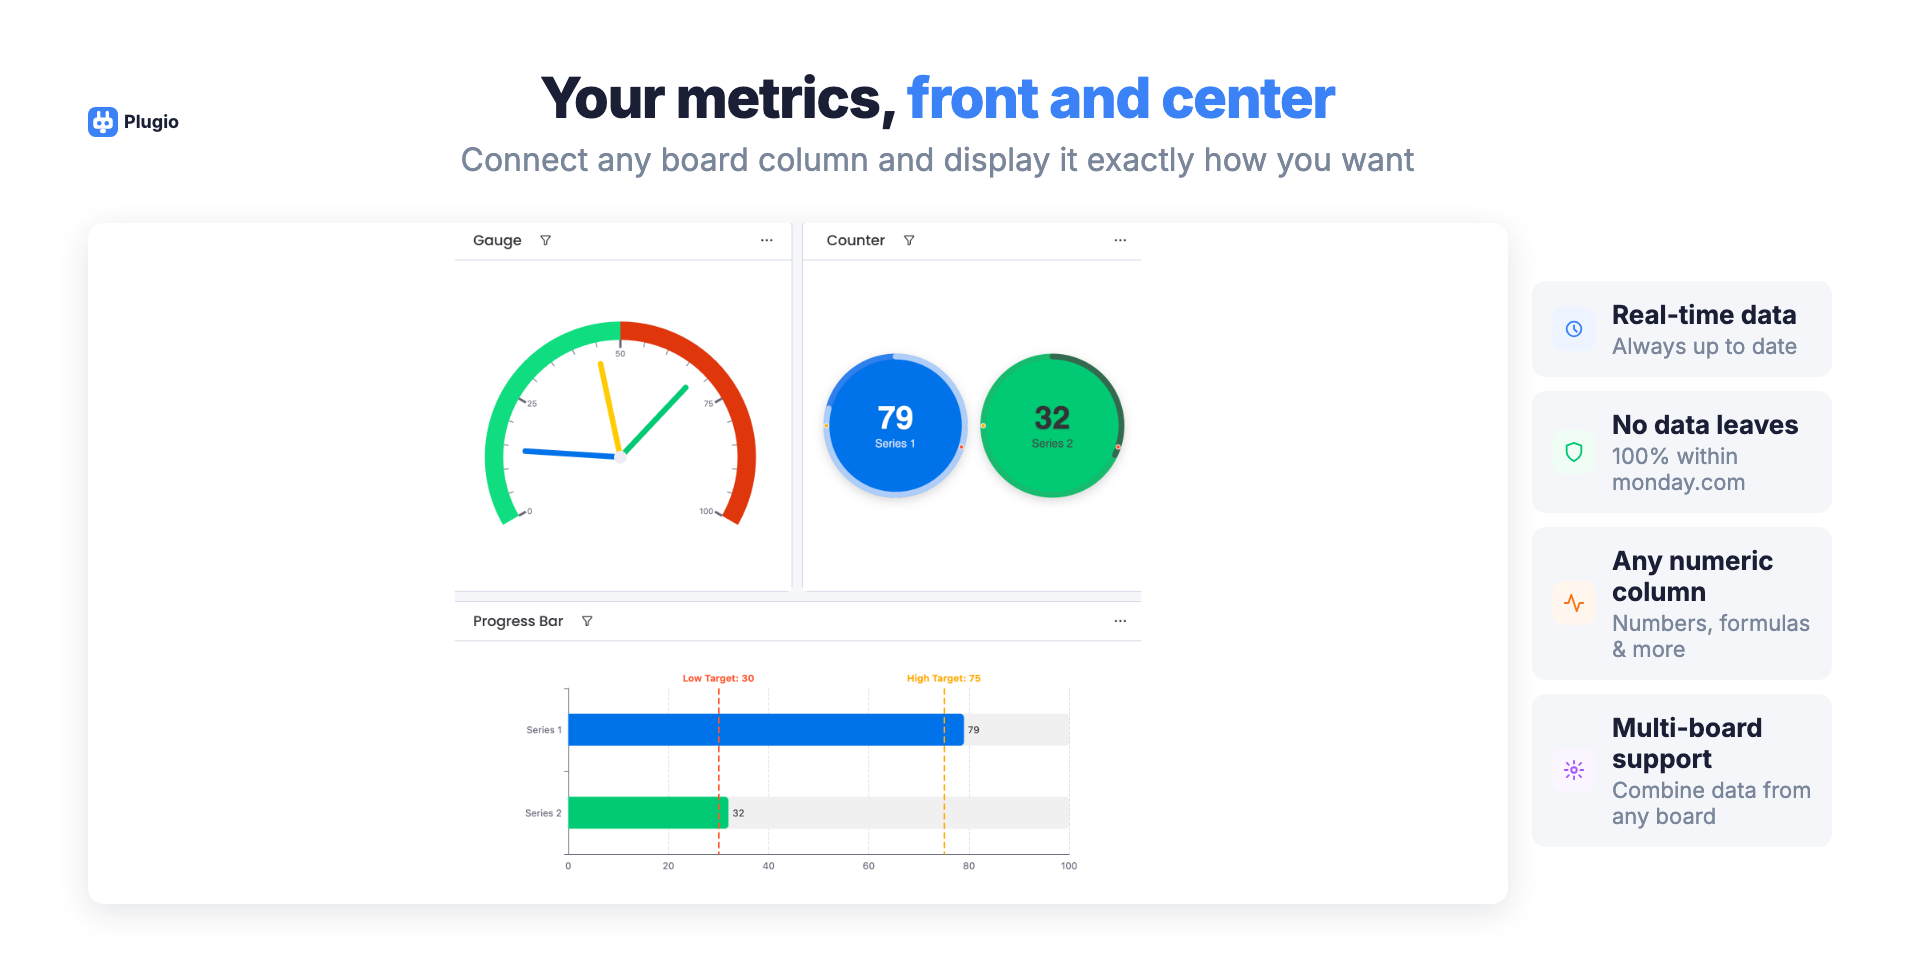
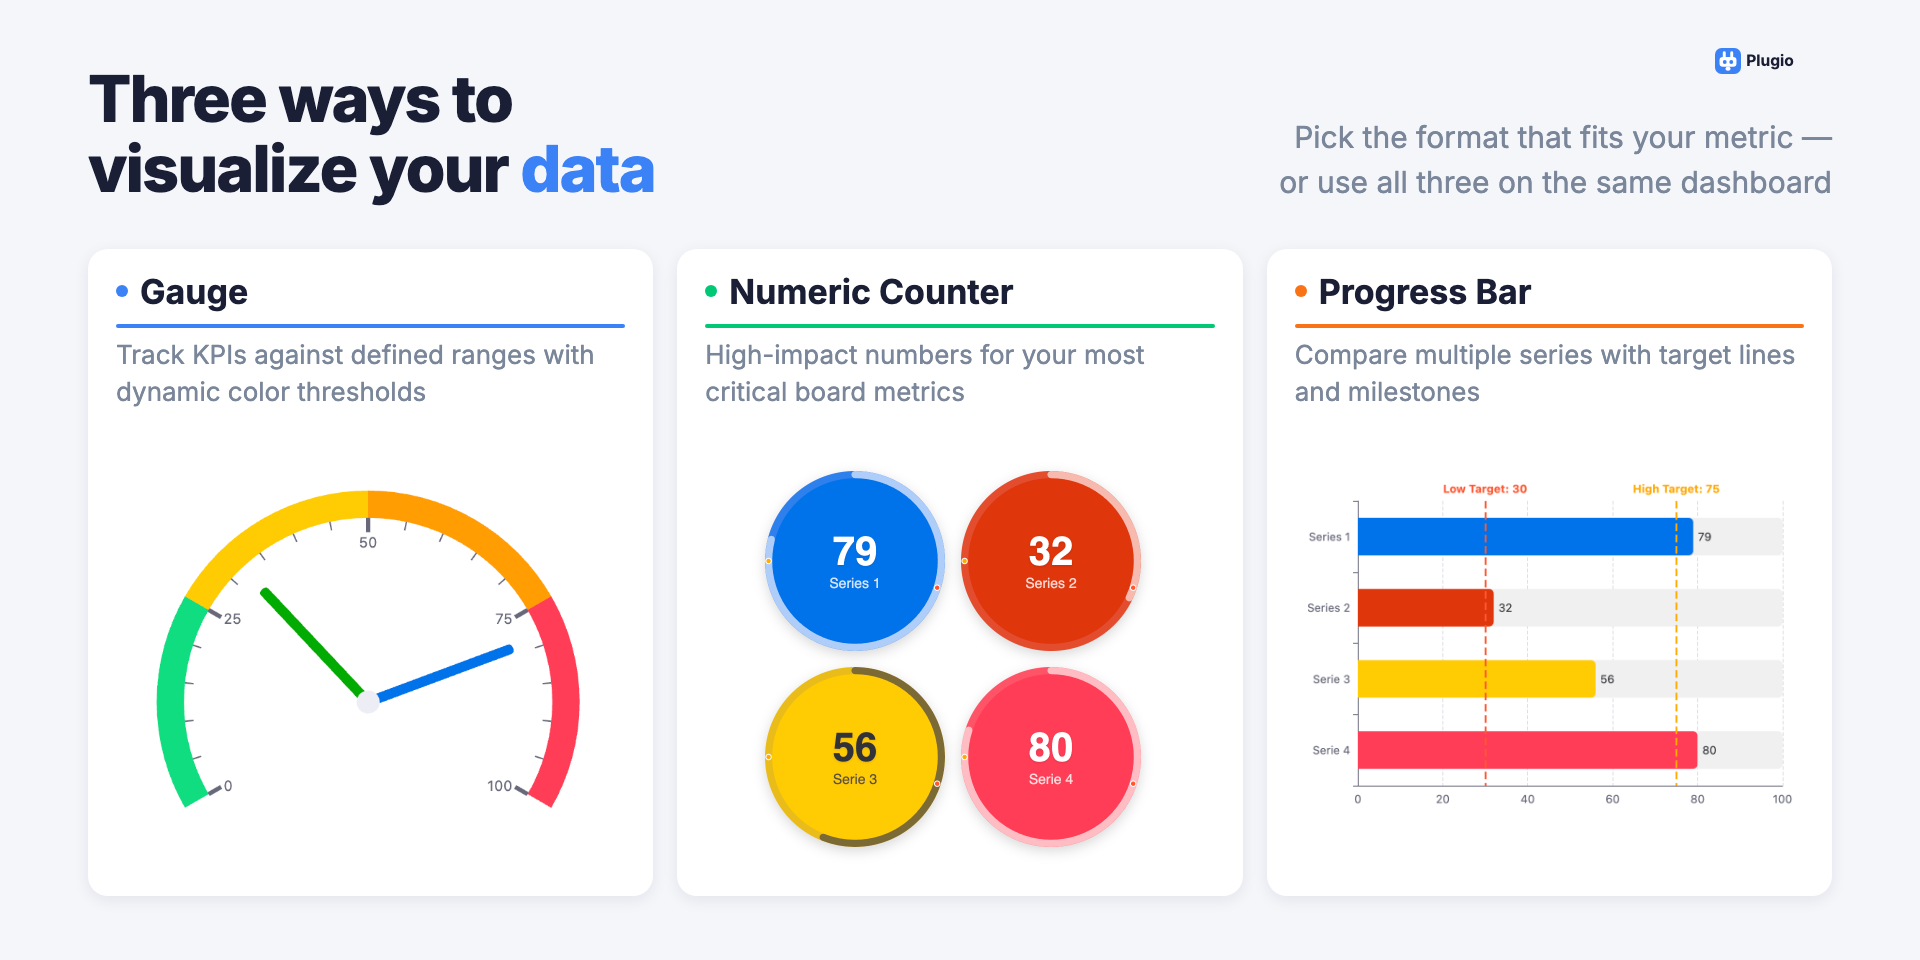
Three visualization types — Radial Gauge, Numeric Counter, and Progress Bar, each fully configurable
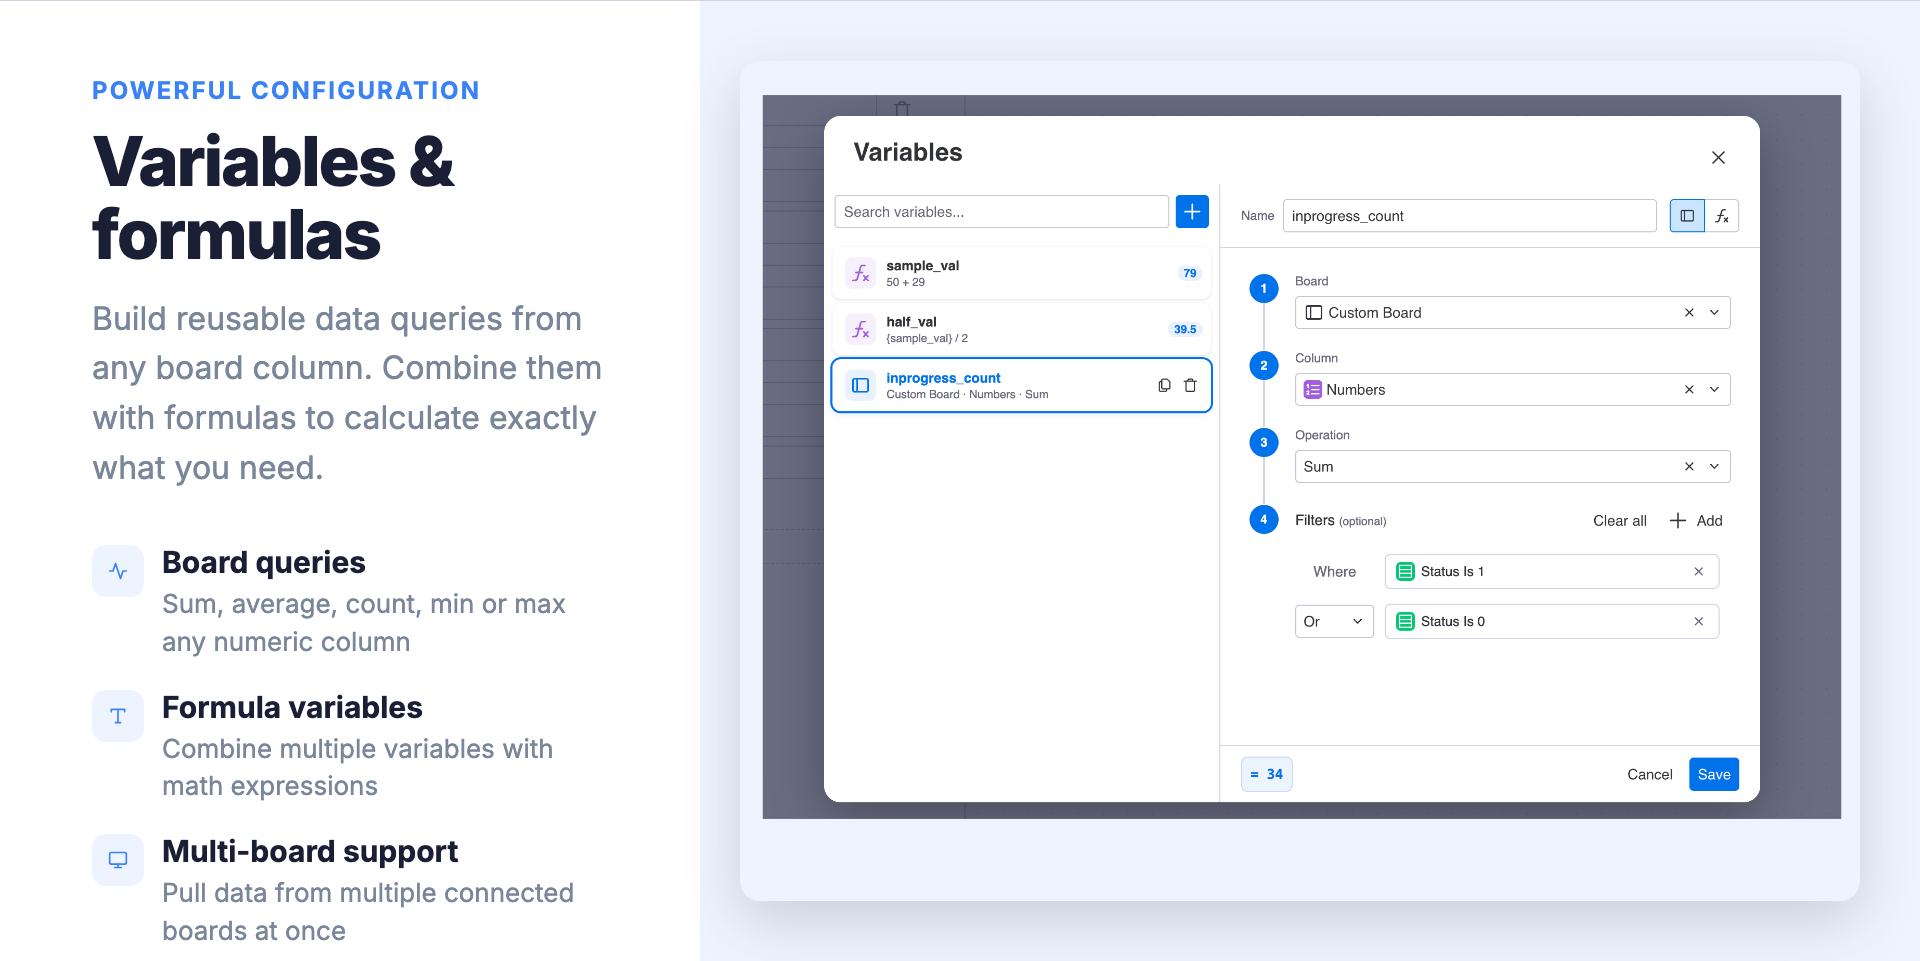
Variables & Formulas — Build reusable data queries (sum, average, count, min, max) and combine them into calculated metrics
Dynamic color thresholds — Green, yellow, and red ranges so your team instantly knows when attention is needed
Target markers — Add reference lines to track goals and milestones
Multi-board support — Pull data from multiple boards into a single widget
100% within monday.com — No data ever leaves your instance. No external servers, no tracking.
Use cases:
Sales team tracking live revenue vs. monthly quota on a radial gauge
Project manager monitoring budget consumption with a progress bar and target marker
Operations lead counting open incidents with a bold numeric counter
Does the developer periodically perform penetration testing?
Not answered
Does the developer have a dedicated security and privacy point of contact for such issues or questions?
Not answered
Does the app restrict redirects and forwards only to approved destinations, or show a warning when redirecting to potentially untrusted content?
Not answered
Does the app protect against mass parameter assignment attacks?
Not answered
Does the app perform encoding and sanitization on all user supplied parameters to protect against Cross-Site Scripting?
Not answered
Does the developer protect all state-changing actions against Cross-Site Request Forgery (CSRF)?
Not answered
Does the developer have mechanisms to notify monday.com in case of a security breach?
Not answered
Does this developer have a process for installing application-level updates and security patches for the service (such as software packages and databases)?
Not answered
Compliance
Is the app certified with the information security standard ISO/IEC 27001:2022?
Not answered
Is the app compliant with the Health Insurance Portability and Accountability Act (HIPAA)?
Not answered
Is the app certified with System and Organization Controls (SOC 2 or SOC 3)?
Not answered
Is the app compliant with the General Data Protection Regulation (GDPR)?
Not answered
Data
Does the app send any data outside of monday.com? If yes, indicate whether the data is customer-submitted (e.g., board names, item names, doc content) or non-customer-submitted (e.g., account ID, board ID, user ID).
No
Where does the app store logs data?
monday
No customer data is stored
Where does the app store the app data?
monday
No customer data is stored
Does the developer ensure application logs do not contain secrets or personally-identifiable information (PII)?
Yes
No customer data is stored
Is customer data segregated from the data of other customers (for example logically or physically)?
Yes
No customer data is stored
Privacy
Does the developer enforce multi-factor authentication on employees access to systems which may process customer data?
Not answered
Does the developer protect access to customer data based on the principle of least privilege?
Yes
Reviews
No reviews yet.
Historical data
Installation history
We have data for December 28, 2024 onwards only. Collected sometime after 00:00 UTC daily.
Total number of installs
Change in total number of installs in last 1 day(s)
Compares the number of installs on each date with 1 days previously:
Max
Min
Current
Change in total number of installs in last 7 day(s)
Compares the number of installs on each date with 7 days previously:
Max
Min
Current
Change in total number of installs in last 30 day(s)
Compares the number of installs on each date with 30 days previously:
Max
Min
Current
Change in total number of installs in last 90 day(s)
Compares the number of installs on each date with 90 days previously:
Max
Min
Current
Change in total number of installs in last 180 day(s)
Compares the number of installs on each date with 180 days previously:
Max
Min
Current
Ratings history
Categories history
Each of the following is a yes/no answer, so the graphs show 1 for yes, and 0 for no.