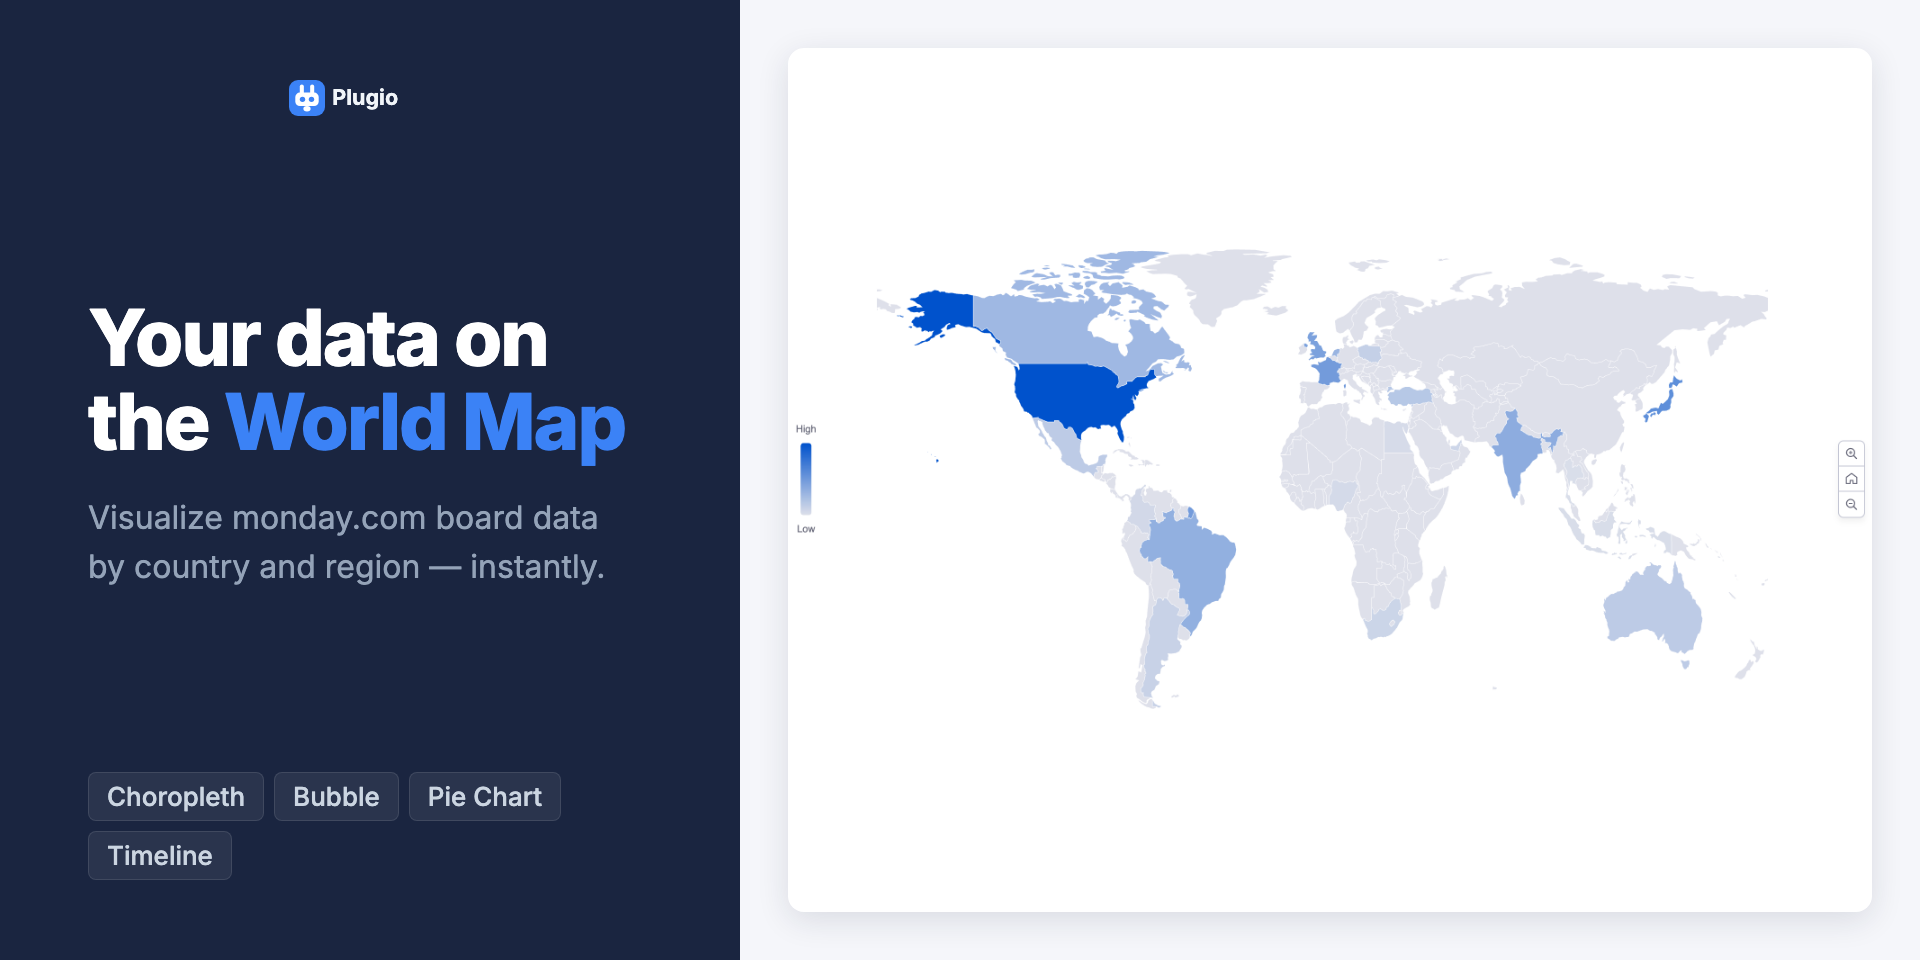
World Map brings geographic intelligence to your monday.com dashboards. Instead of static lists or pin-based maps, see your board data as a color-coded world map — darker regions mean higher values, lighter regions mean lower. At a glance, you know exactly where your customers, deals, or projects are concentrated. (Please note: The Dashboard widget currently supports connecting only one board at a time to proceed.)
VISUALIZATION MODES
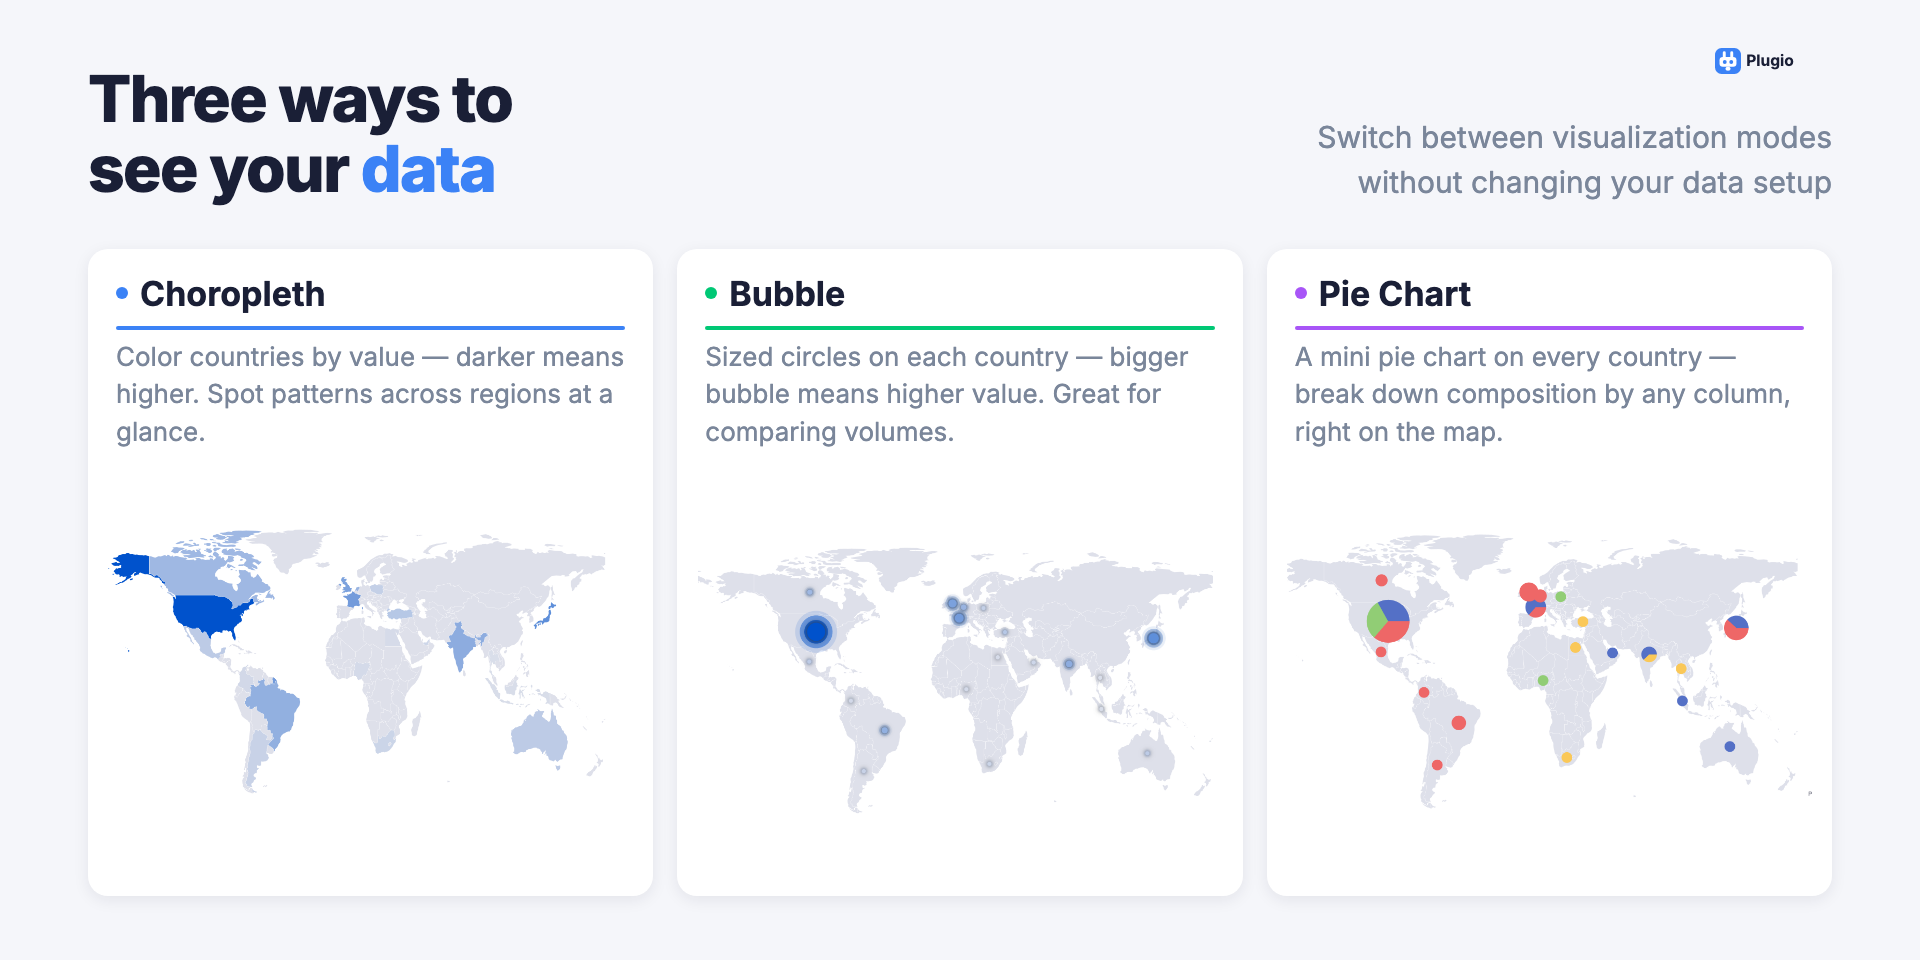
Choose from three ways to display your data on the map:
• Choropleth — color countries by value using a gradient scale
• Bubble — sized circles scaled proportionally to your metric
• Pie Chart — break down composition by any column, right on the map
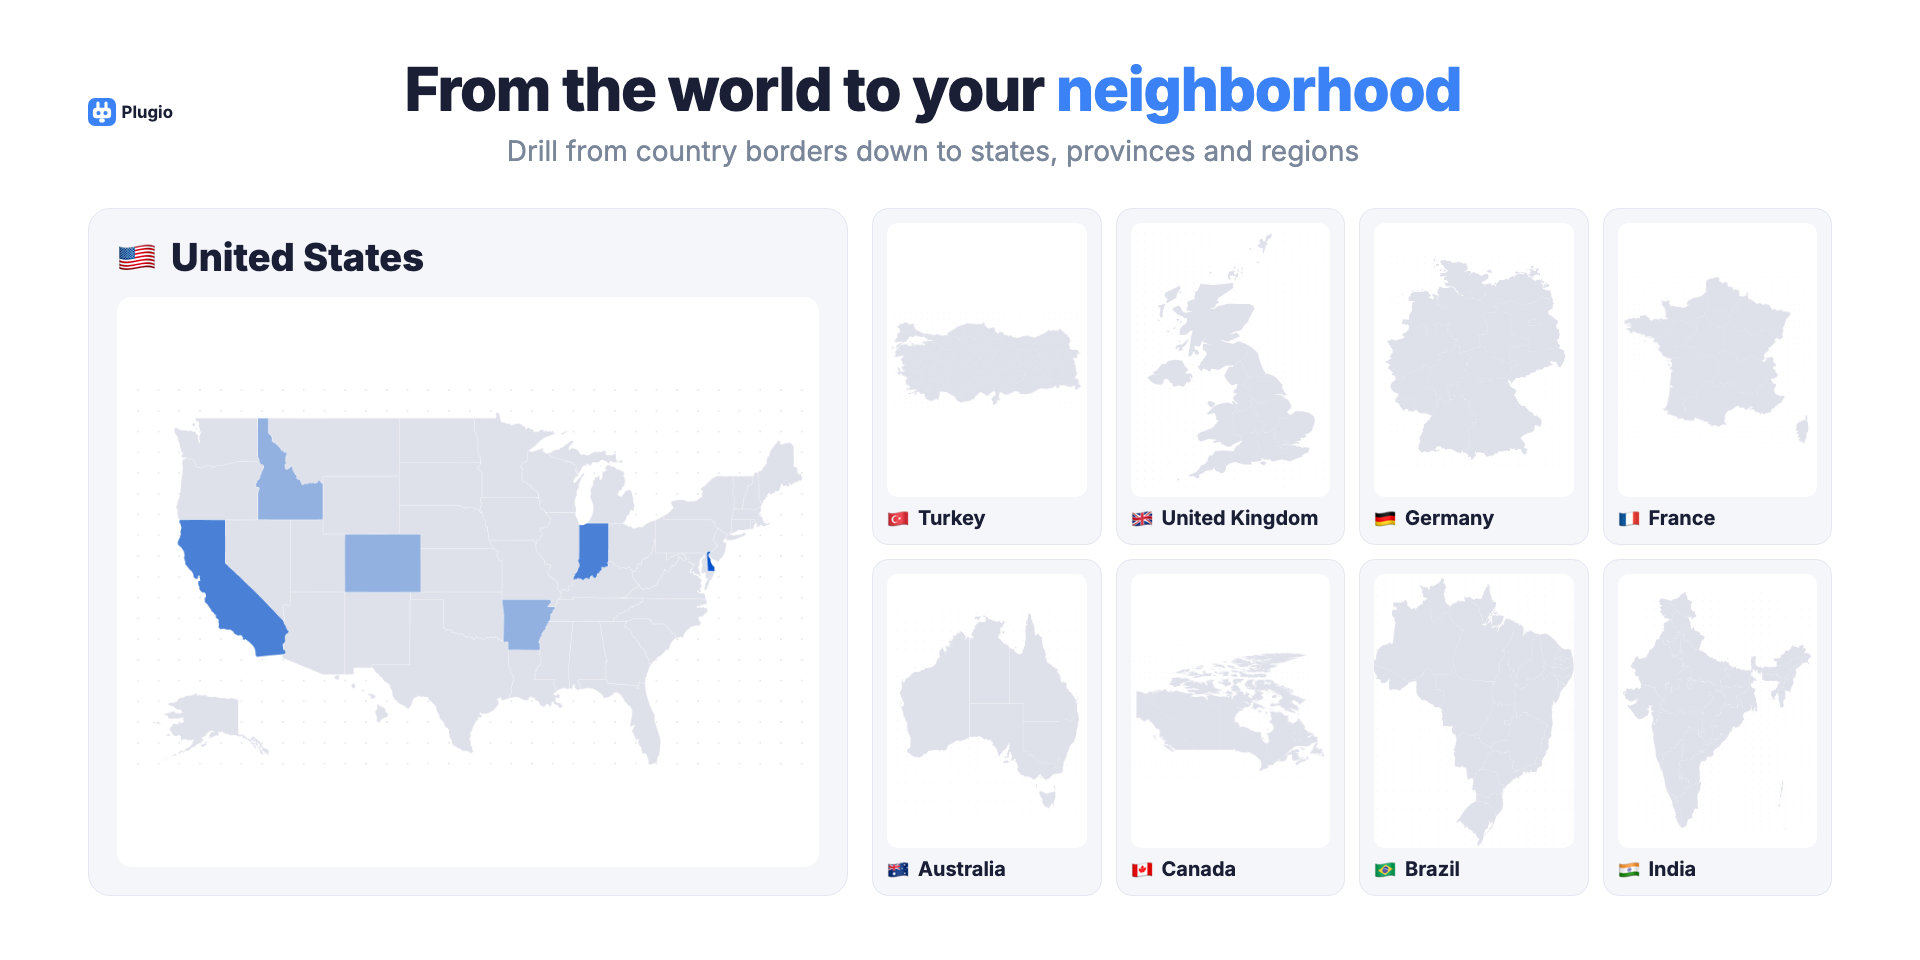
10 BUILT-IN MAPS
Start with a world overview, then zoom into country-level regions: United States (52 states), Turkey (81 provinces), United Kingdom (12 regions), Germany (16 states), France (13 régions), Australia, Canada, Brazil, and India. All in a single widget.
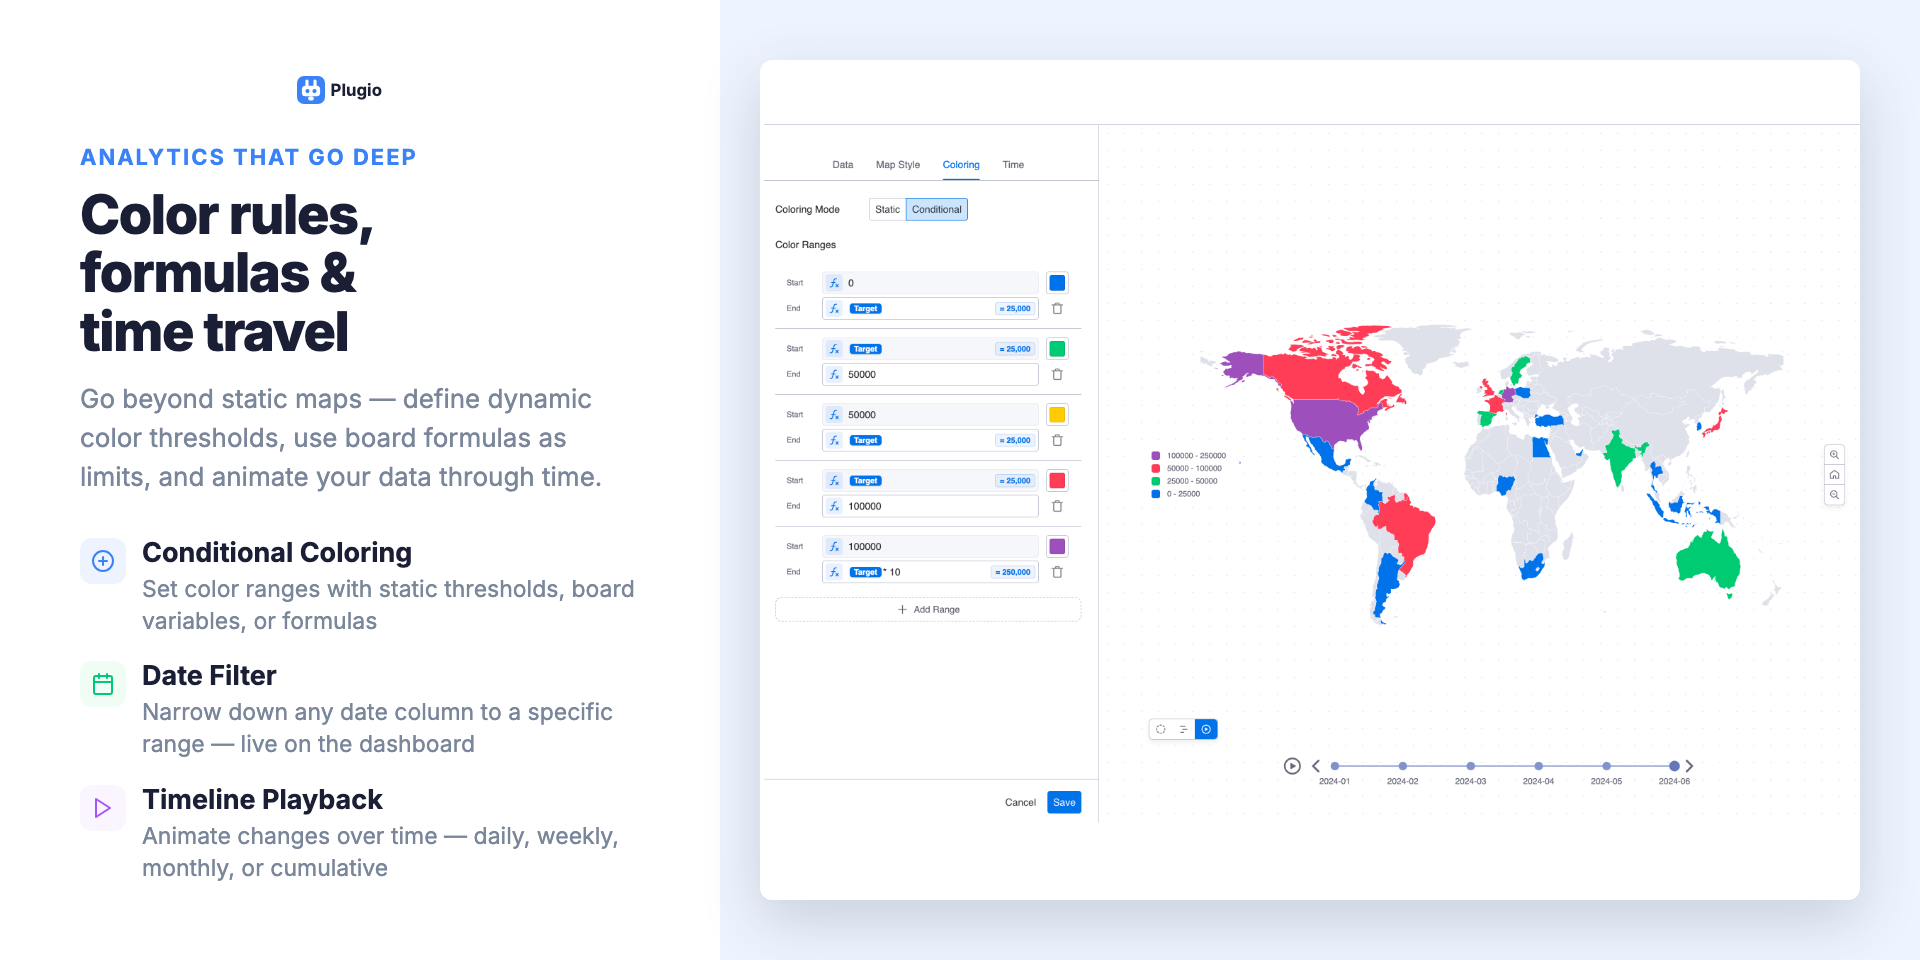
TIMELINE & PLAYBACK
Attach a date column and filter your map by date range interactively, or animate changes through time — daily, weekly, monthly, quarterly, or cumulative. Watch your data evolve over time without leaving your dashboard.
CONDITIONAL COLORING
Define color thresholds with static values, board variables, or formulas. Color countries red below 50, yellow between 50 and 100, and green above — driven dynamically by your board data.
WORKS WITH YOUR EXISTING DATA
Supports Location, Country, and text columns. Aggregates by count, sum, average, minimum, or maximum. No data leaves monday.com.
HOW TO USE
Add the World Map widget to your monday.com dashboard.
Select the board you wish to visualize (Important: The widget supports only one board to proceed).
Choose your visualization mode, map type, and configure your location and data columns to see your geographic insights come to life!
Security & Compliance
Security
Does the developer periodically perform penetration testing?
Not answered
Does the developer have a dedicated security and privacy point of contact for such issues or questions?
Not answered
Does the app restrict redirects and forwards only to approved destinations, or show a warning when redirecting to potentially untrusted content?
Not answered
Does the app protect against mass parameter assignment attacks?
Not answered
Does the app perform encoding and sanitization on all user supplied parameters to protect against Cross-Site Scripting?
Not answered
Does the developer protect all state-changing actions against Cross-Site Request Forgery (CSRF)?
Not answered
Does the developer have mechanisms to notify monday.com in case of a security breach?
Not answered
Does this developer have a process for installing application-level updates and security patches for the service (such as software packages and databases)?
Not answered
Compliance
Is the app certified with the information security standard ISO/IEC 27001:2022?
Not answered
Is the app compliant with the Health Insurance Portability and Accountability Act (HIPAA)?
Not answered
Is the app certified with System and Organization Controls (SOC 2 or SOC 3)?
Not answered
Is the app compliant with the General Data Protection Regulation (GDPR)?
Not answered
Data
Does the app send any data outside of monday.com? If yes, indicate whether the data is customer-submitted (e.g., board names, item names, doc content) or non-customer-submitted (e.g., account ID, board ID, user ID).
No
Where does the app store logs data?
monday
No customer data is stored
Where does the app store the app data?
monday
No customer data is stored
Does the developer ensure application logs do not contain secrets or personally-identifiable information (PII)?
Yes
No customer data is stored
Is customer data segregated from the data of other customers (for example logically or physically)?
Yes
No customer data is stored
Privacy
Does the developer enforce multi-factor authentication on employees access to systems which may process customer data?
Not answered
Does the developer protect access to customer data based on the principle of least privilege?
Yes
Reviews
No reviews yet.
Historical data
Installation history
We have data for December 28, 2024 onwards only. Collected sometime after 00:00 UTC daily.
Total number of installs
Change in total number of installs in last 1 day(s)
Compares the number of installs on each date with 1 days previously:
Max
Min
Current
Change in total number of installs in last 7 day(s)
Compares the number of installs on each date with 7 days previously:
Max
Min
Current
Change in total number of installs in last 30 day(s)
Compares the number of installs on each date with 30 days previously:
Max
Min
Current
Change in total number of installs in last 90 day(s)
Compares the number of installs on each date with 90 days previously:
Max
Min
Current
Change in total number of installs in last 180 day(s)
Compares the number of installs on each date with 180 days previously:
Max
Min
Current
Ratings history
Categories history
Each of the following is a yes/no answer, so the graphs show 1 for yes, and 0 for no.