Visual workload heatmap by calendar, person, or group.
See your board's workload density as a calendar heatmap.
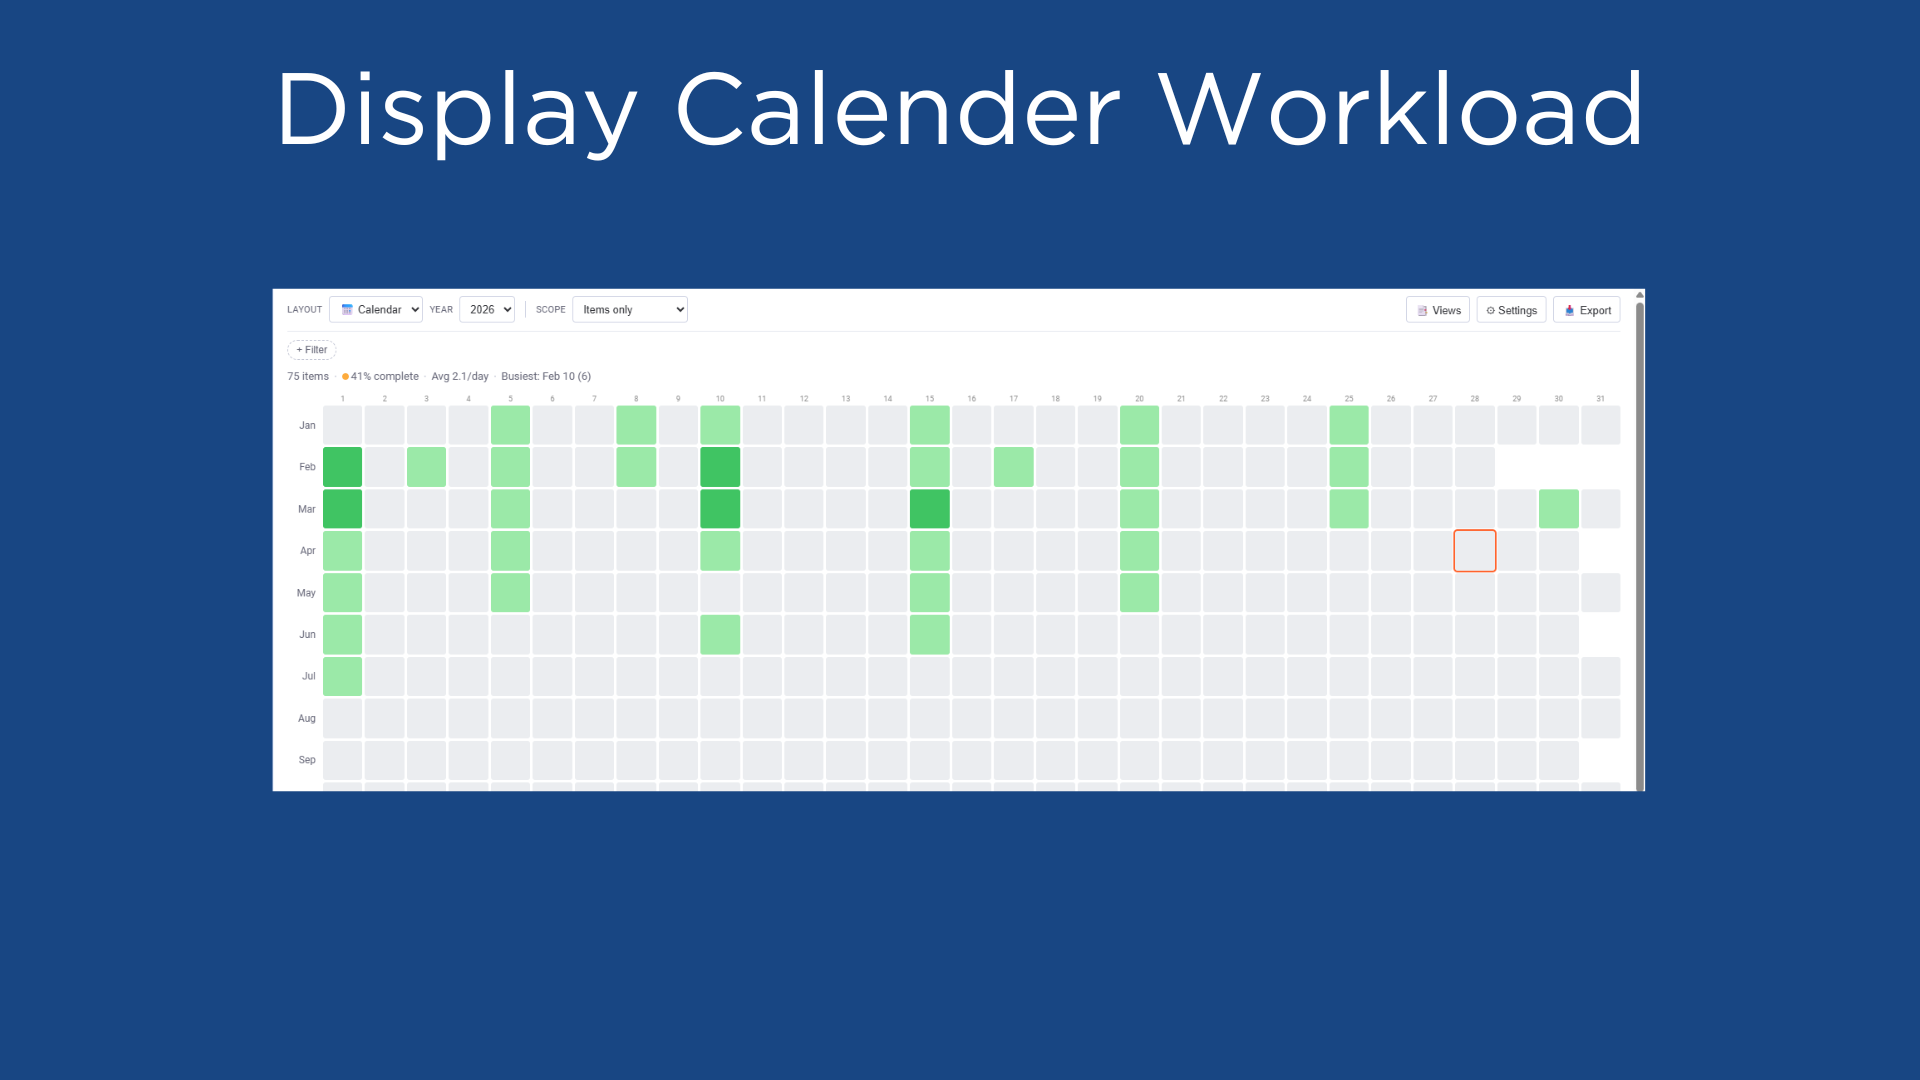
Board Heatmap turns your board data into a beautiful, interactive heatmap — like GitHub's contribution graph, but for your monday.com projects. Each day is a colored square. The darker the color, the more items are due. Instantly spot overloaded weeks, quiet periods, and workload imbalances across your entire year.
View by calendar, person, or group. Filter by status or owner. Track subitems alongside parent items. Save your favorite views and export as PNG.
🗓️ Three Layout Views:
Calendar — 12×31 year grid showing item density per day
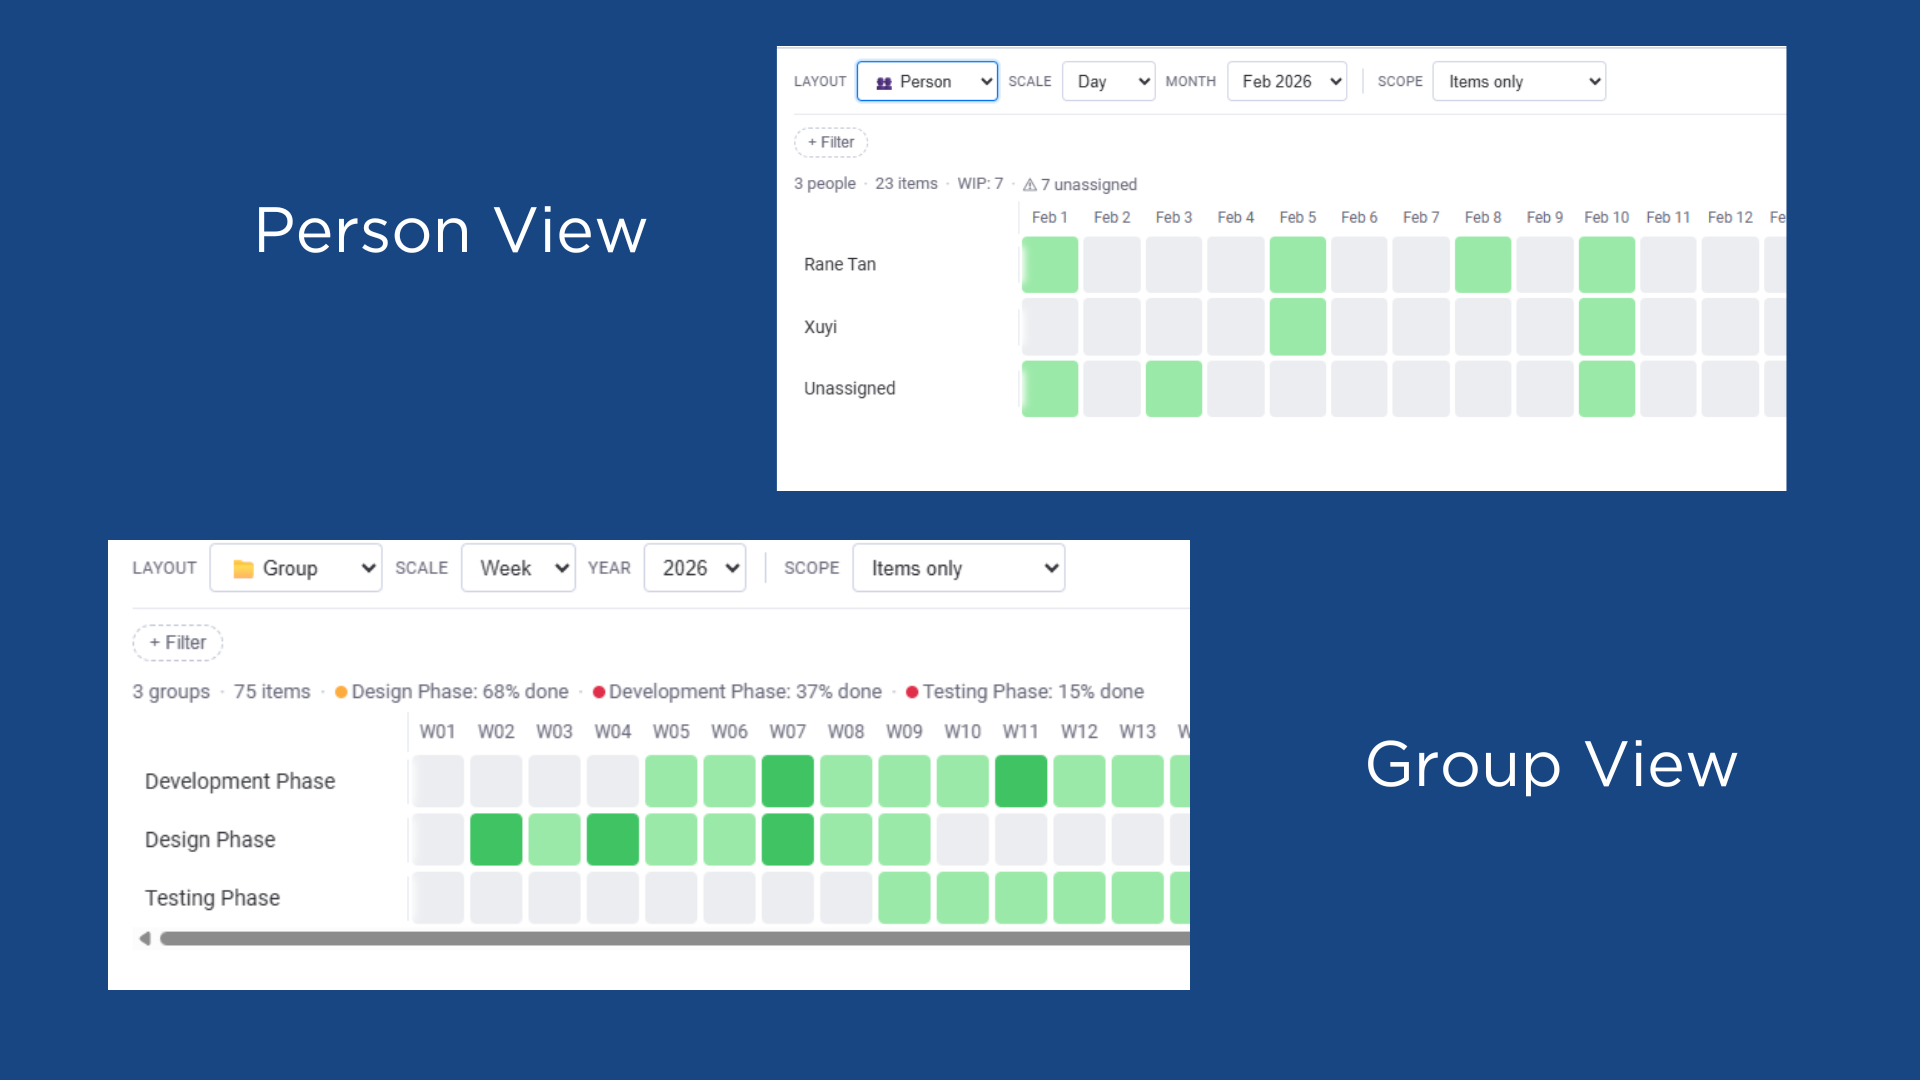
Person — See each team member's workload side by side
Group — Compare workload across board groups
⏱️ Flexible Time Scales:
Day, Week, or Month granularity for Person and Group views
Year navigation to compare patterns across time
🔍 Powerful Filters (Pro):
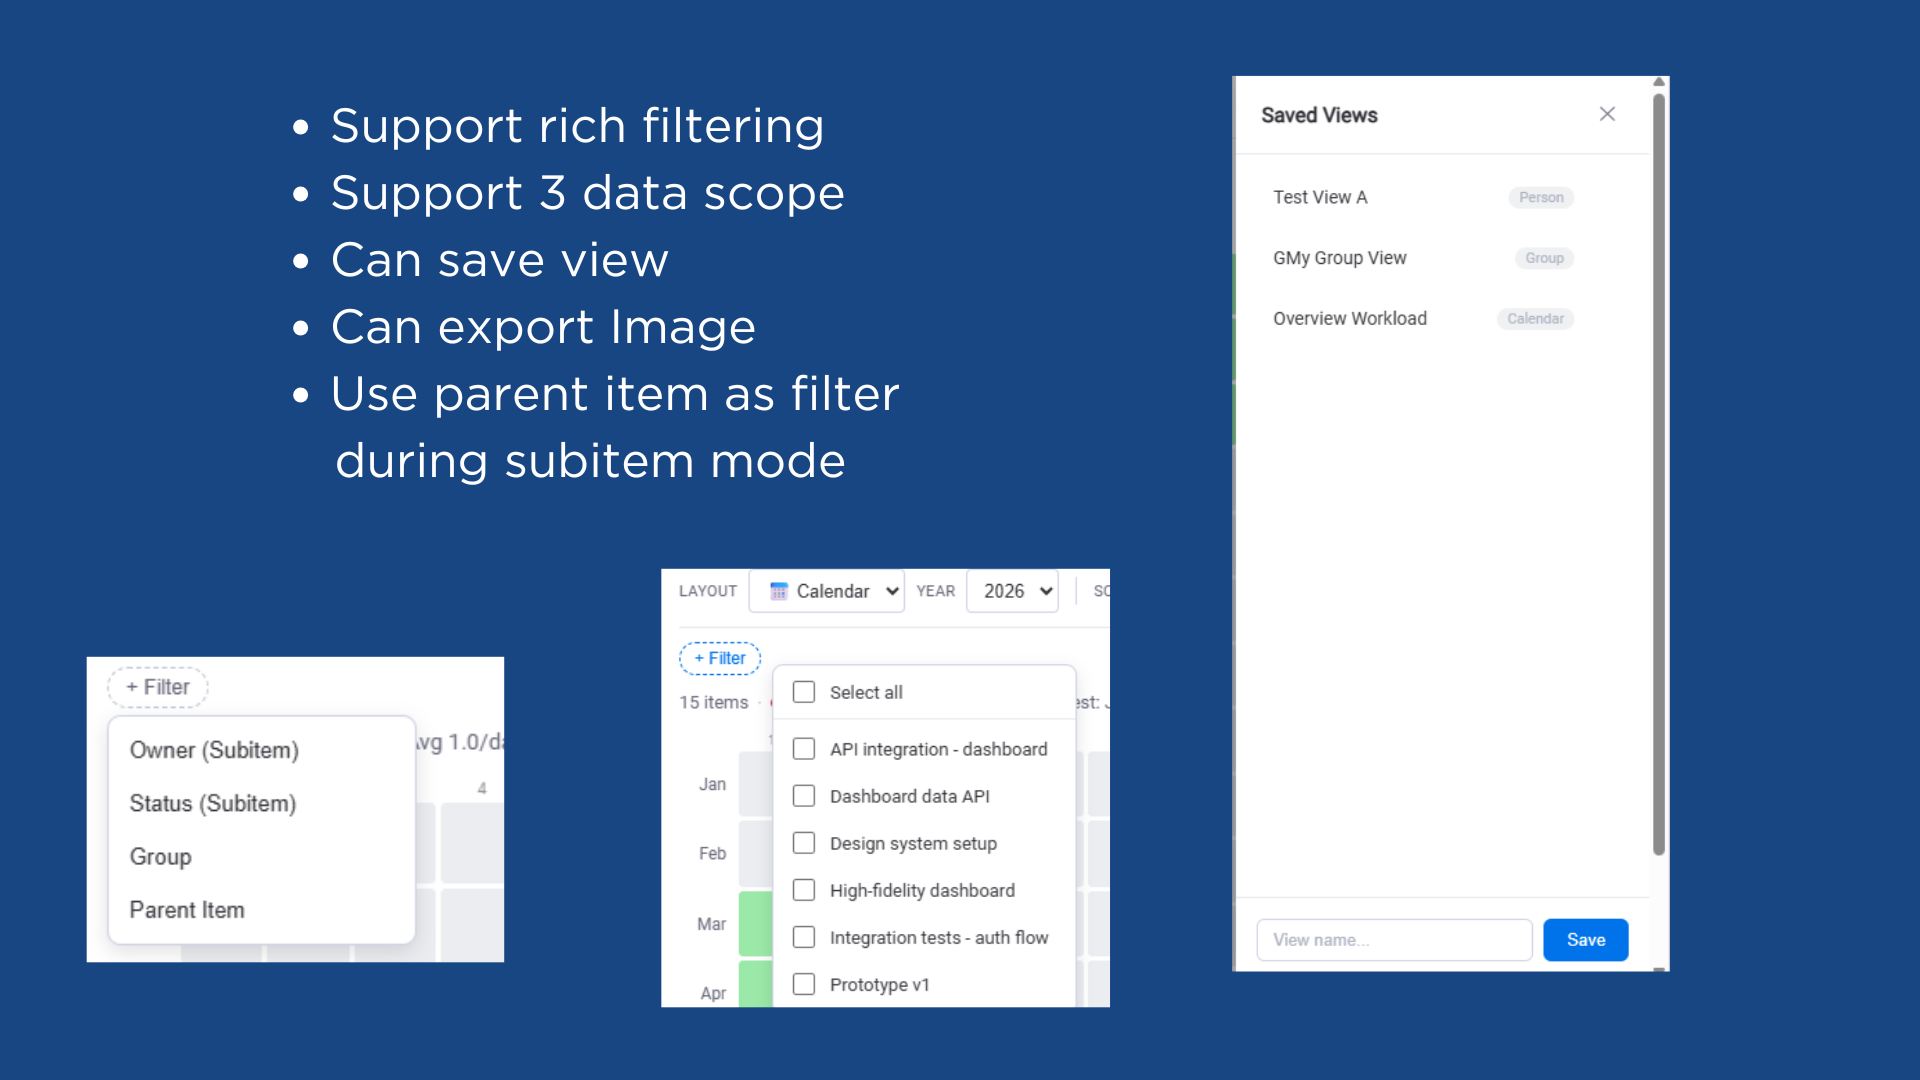
Filter by person, status, group, or parent item
AND logic between filters for precise drill-downs
Multi-select within each filter type
📊 Subitems Support (Pro):
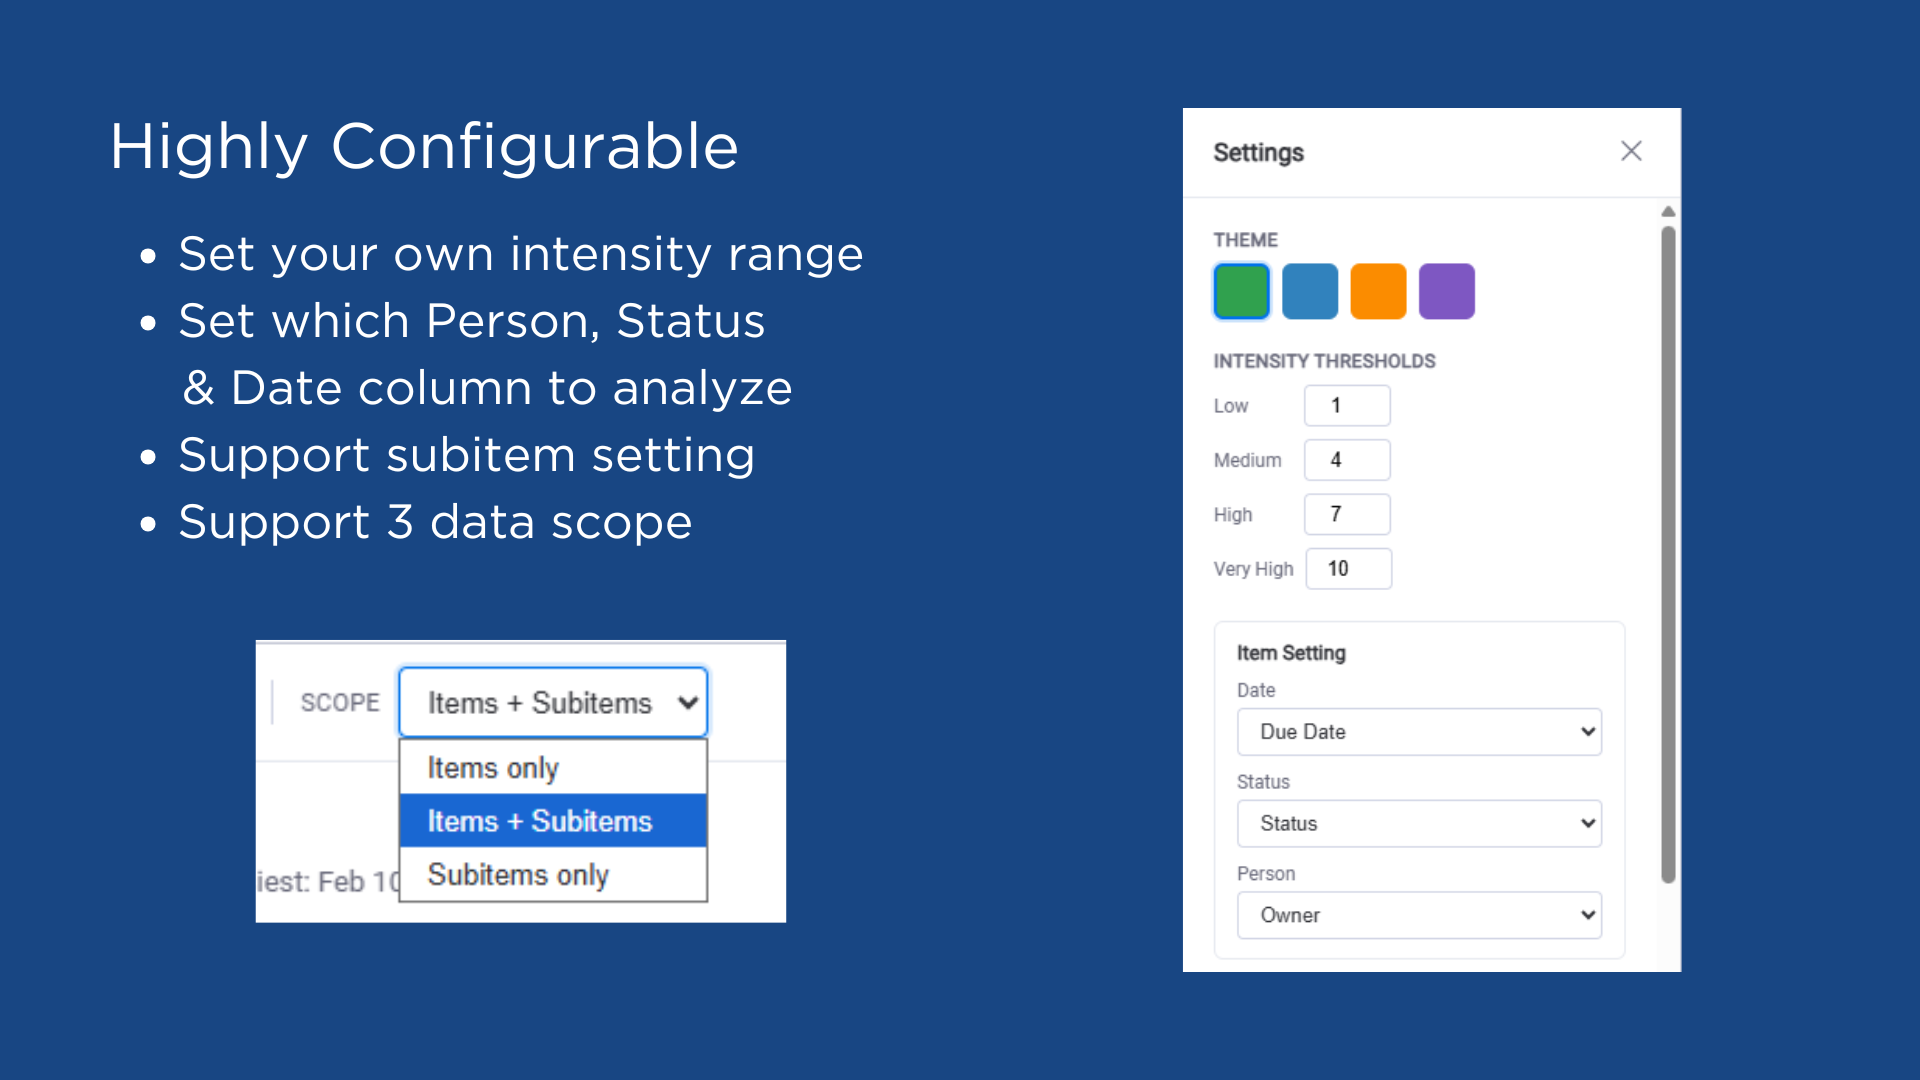
Items only, Subitems only, or both combined
Separate column configuration for subitem date, status, and person
Filter subitems by parent item
💾 Saved Views (Pro):
Save layout, filters, and column settings as named views
Switch between views instantly
Share board-level settings across your team
🎨 Customization:
4 color themes — Green, Blue, Orange, and Purple
Adjustable intensity thresholds (Pro)
Interactive day details — click any cell to see items, click an item to open it
Today indicator and keyboard navigation
📥 PNG Export (Pro):
Export your heatmap as a high-resolution image for reports and presentations
Common Use Cases:
Project managers — Track delivery cadence and spot deadline clusters
Team leads — Balance workload across team members and catch overloaded days
Operations teams — Identify bottleneck periods and plan capacity
Sprint planning — Compare group progress and velocity at a glance
Privacy & Security: Board Heatmap only requires read access to your board data. It does not modify, create, or delete any items. No data is stored on external servers — all settings are saved within monday.com's built-in storage.
Security & Compliance
The app developer did not provide the security and compliance information for this app.
Reviews
No reviews yet.
Historical data
Installation history
We have data for December 28, 2024 onwards only. Collected sometime after 00:00 UTC daily.
Total number of installs
Change in total number of installs in last 1 day(s)
Compares the number of installs on each date with 1 days previously:
Max
Min
Current
Change in total number of installs in last 7 day(s)
Compares the number of installs on each date with 7 days previously:
Max
Min
Current
Change in total number of installs in last 30 day(s)
Compares the number of installs on each date with 30 days previously:
Max
Min
Current
Change in total number of installs in last 90 day(s)
Compares the number of installs on each date with 90 days previously:
Max
Min
Current
Change in total number of installs in last 180 day(s)
Compares the number of installs on each date with 180 days previously:
Max
Min
Current
Ratings history
Categories history
Each of the following is a yes/no answer, so the graphs show 1 for yes, and 0 for no.