App metadata ID: 10001037 • App ID: 10730324 • Listing updated: April 5, 2026 View app data JSON {
"id": 10001037,
"marketplace_developer_id": 100000149,
"app_id": 10730324,
"app_type": "app",
"security_info": {},
"gallery_assets": [
{
"url": "https://cdn.monday.com/marketplace/10001037/10001037_2026_0_27_8_43_51_u2om99l.png",
"type": "image"
},
{
"url": "https://cdn.monday.com/marketplace/10001037/10001037_2026_0_27_8_44_1_wfqn0mh.png",
"type": "image"
},
{
"url": "https://cdn.monday.com/marketplace/10001037/10001037_2026_0_27_8_44_4_z9e2qbm.png",
"type": "image"
}
],
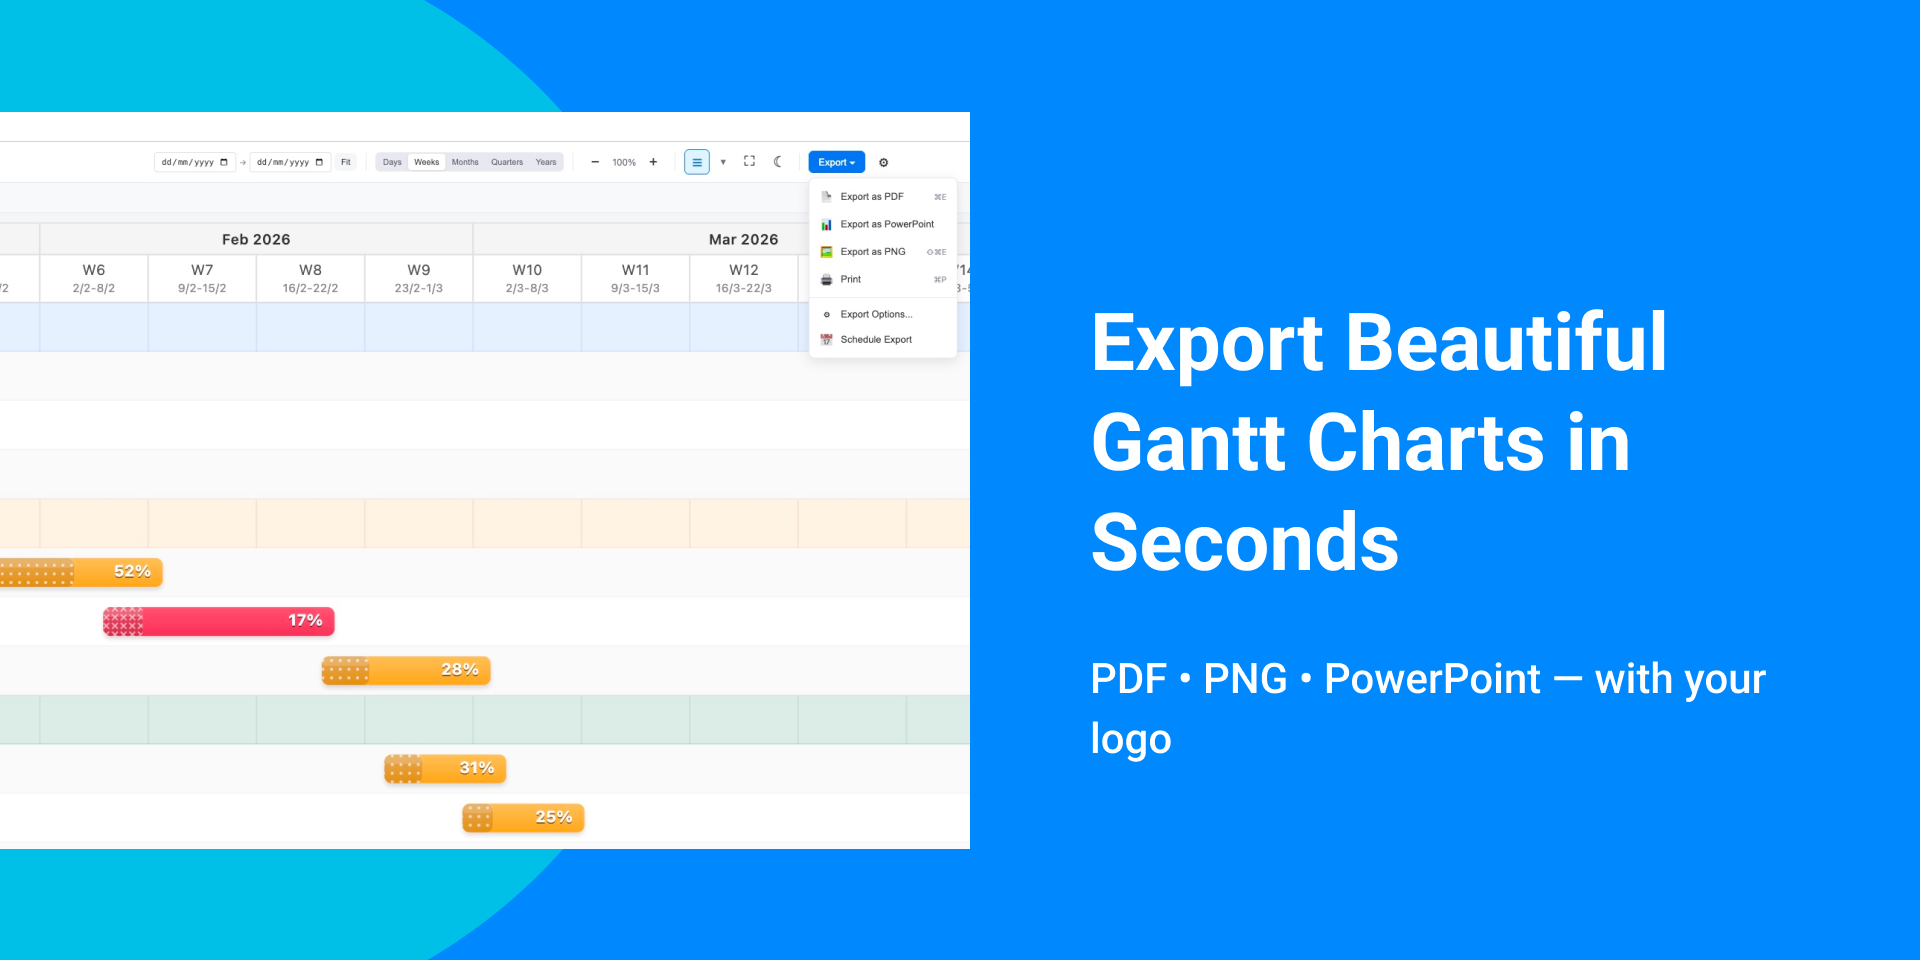
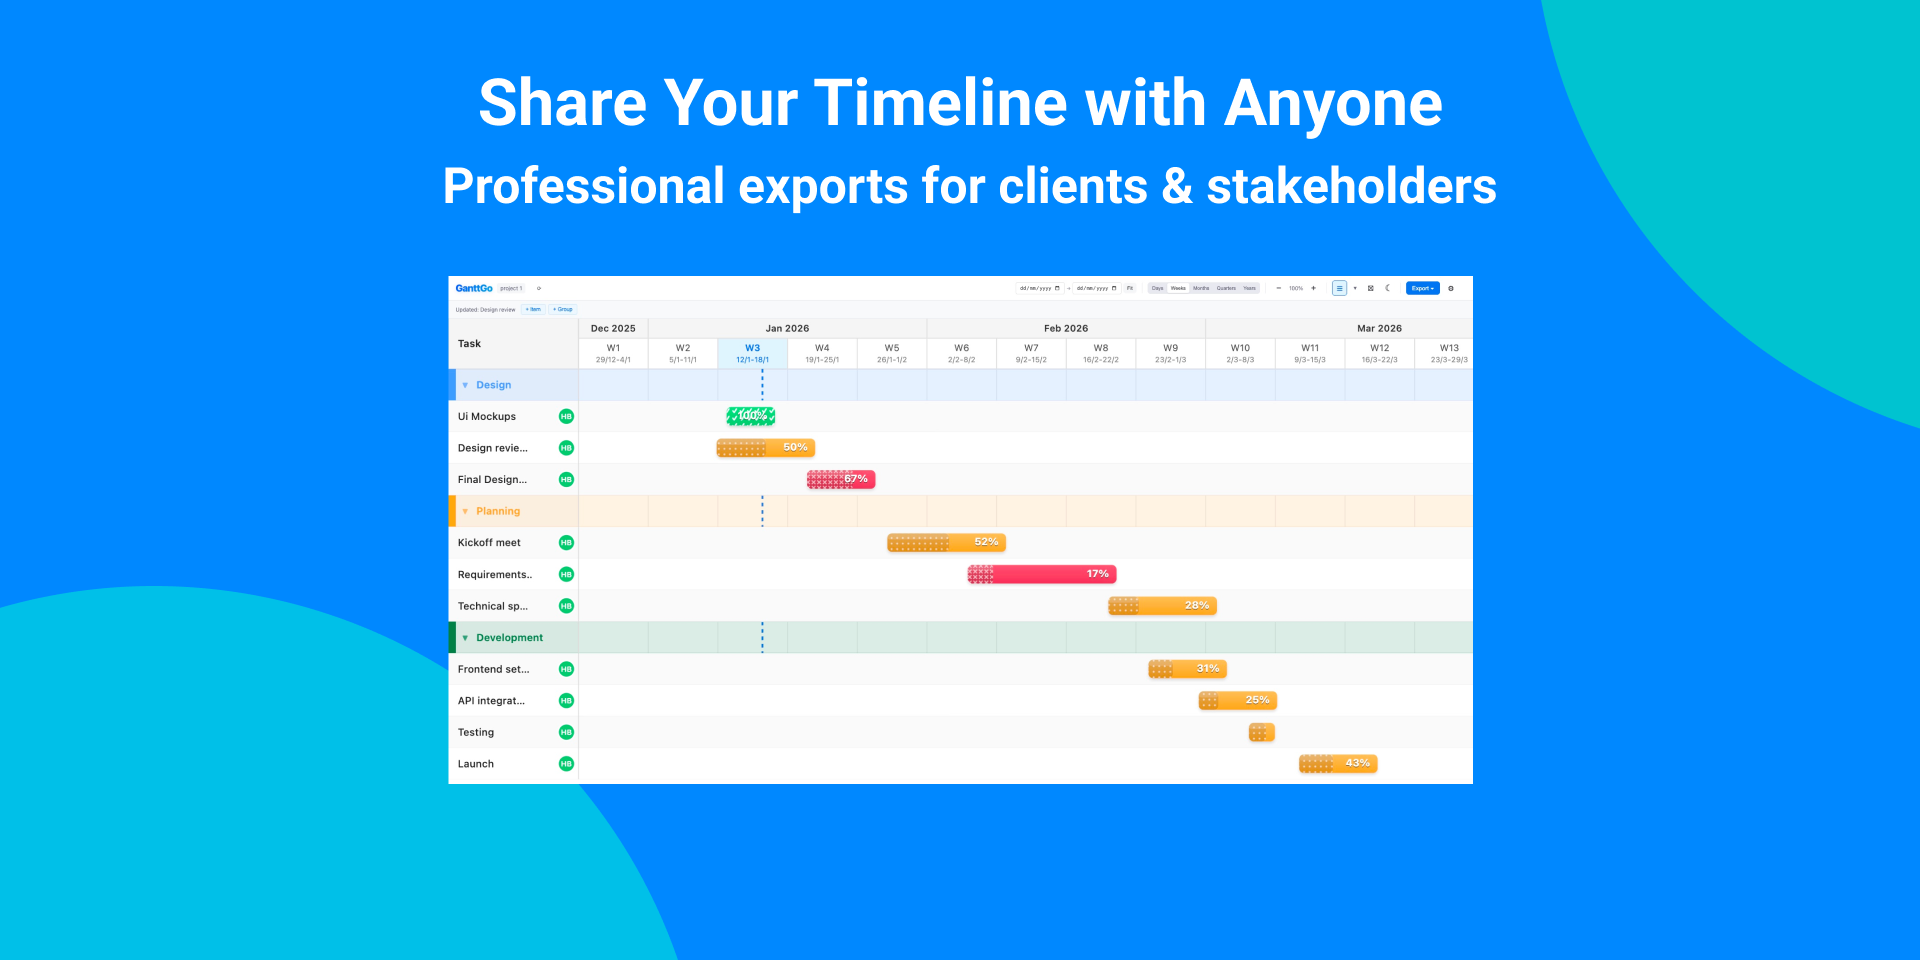
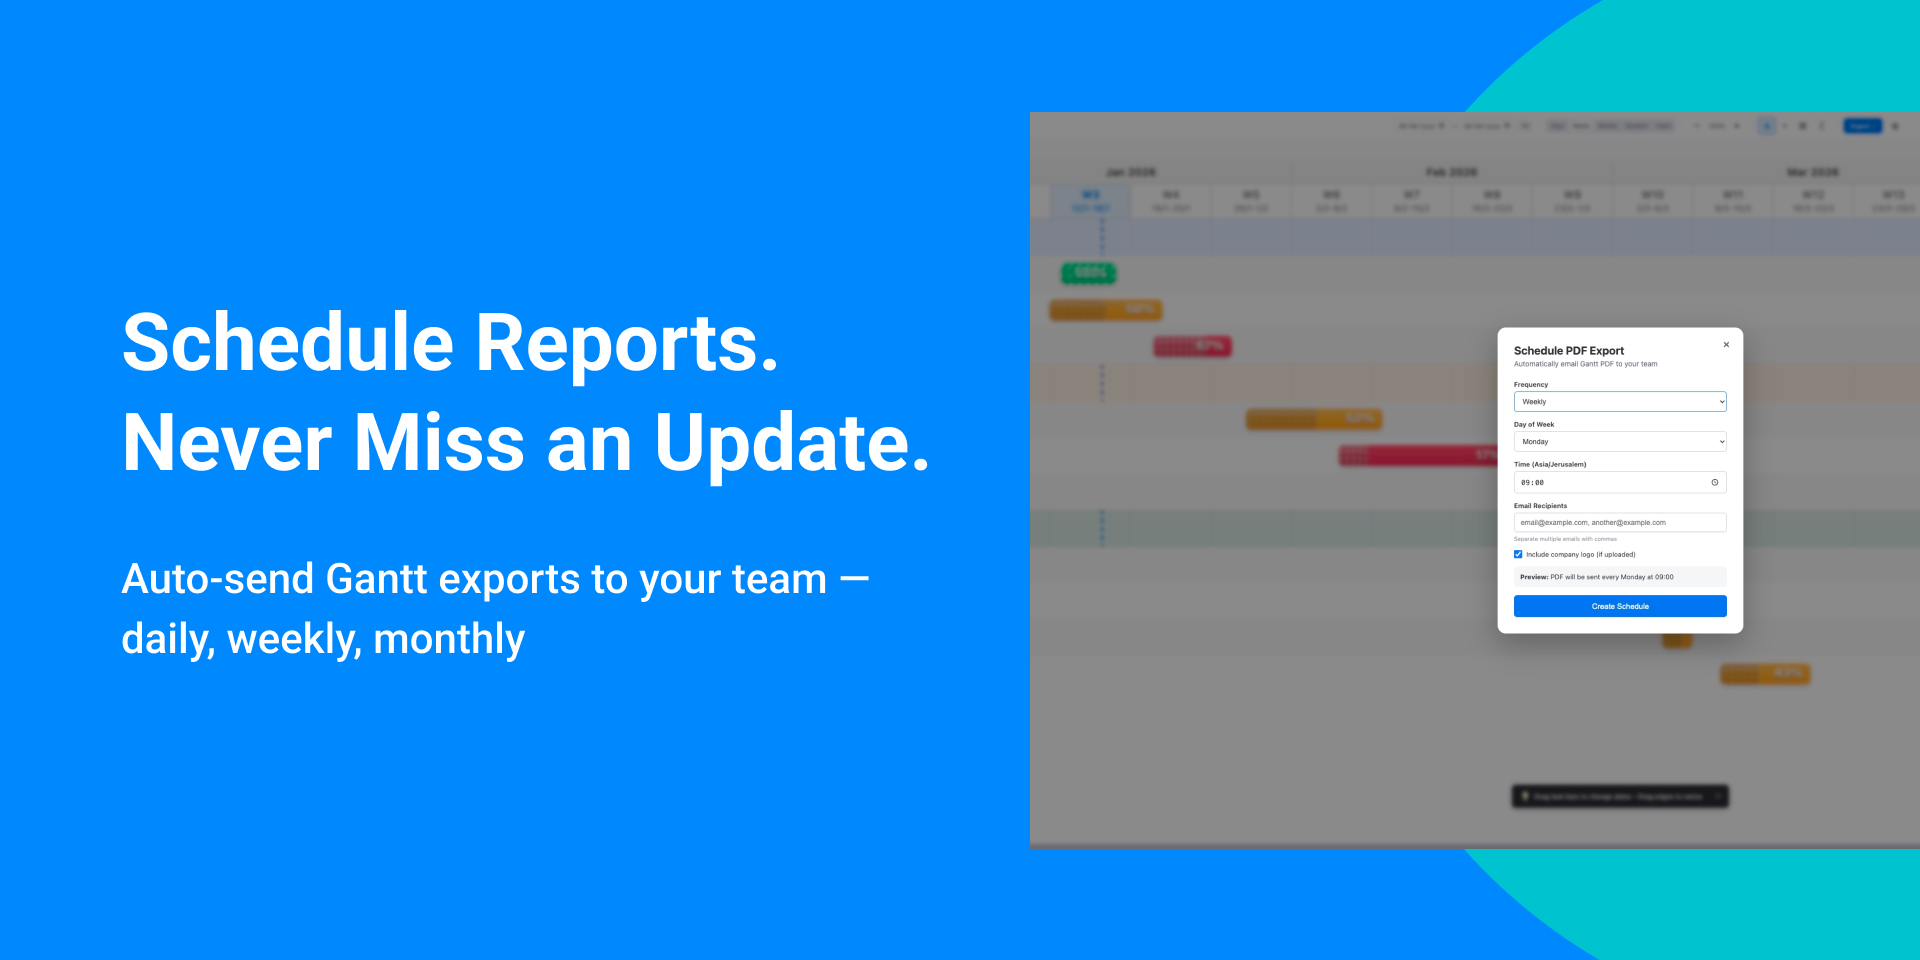
"description": "<p>GanttGo transforms your monday.com data into interactive Gantt charts. No setup, no migration, no learning curve. Just open the app and see your timeline.</p><p> </p><p><strong> What you get</strong></p><p> 📊 Visual timeline by groups </p><p> Tasks organized by monday groups with color coding. Sort groups chronologically by date </p><p> or keep board orderSubitems display with proper indentation.</p><p><br></p><p><strong> 🔗 Dependencies</strong></p><p> Draw relationships by dragging between tasks. Arrows render in exports — not just on screen.</p><p><br></p><p><strong> 🔴 Critical path highlighting</strong></p><p> Spot tasks that will delay your project if they slip. Know where to focus.</p><p> </p><p><strong> 📅 Holidays & weekends </strong></p><p> Country presets (US, UK, EU, German, French) or custom dates. Tasks respect non-working days. </p><p><br></p><p><strong> 📤 Export anywhere</strong></p><p> PDF (multi-page), Excel, PowerPoint, PNG. Dependencies and formatting stay intact.</p><p> </p><p><strong> ⚡ Handles large boards</strong></p><p> Up to 1,000 items on Pro and Trial. Free supports 50 items.</p><p><br></p><p><strong> Perfect for </strong></p><p> - Project managers tracking deliverables across sprints </p><p> - Agencies sharing timelines with clients </p><p> - Construction teams managing phased work </p><p> - Anyone who needs clean exports for presentations </p><p> </p><p><strong> Why teams choose GanttGo </strong></p><p> ✓ Works with existing boards, no migration </p><p> ✓ Drag-to-edit syncs back to monday in real time</p><p> ✓ Exports that actually look good</p><p> ✓ Simple enough that the whole team will use it</p><p><br></p><p> 14<strong>-day free trial with full Pro access. </strong></p><p><strong> Questions? support@ganttgo.com</strong></p>",
"short_description": "Multi-page Gantt exports (PDF, Excel, PPT) with dependencies",
"thumbnail_url": "https://cdn.monday.com/marketplace/10001037/10001037_2026_0_27_8_43_39_vibpaid.png",
"logo_url": "https://cdn.monday.com/marketplace/10001037/10001037_2026_0_27_8_43_37_2bwnc1j.png",
"feedback_url": "support@ganttgo.com",
"privacy_policy_url": "https://ganttgo.com/privacy",
"featured": false,
"name": "GanttGo",
"how_to_use_url": "https://ganttgo.com/guide",
"external_pricing_url": null,
"keywords": "critical path,dependencies,project schedule,project timeline,gantt,gantt view,pdf export,gantt chart,gantt export,gantt pdf",
"compliance_answers": [],
"created_at": "2026-01-27T08:38:59.000Z",
"updated_at": "2026-04-05T11:36:58.000Z",
"automation_app_id": null,
"marketplace_category_ids": [
10000001,
9,
6
],
"pinned_for_categories_ids": [],
"featured_for_categories_ids": [],
"pricing_data": null,
"label": null,
"app_values": [
"Easier resource management"
],
"security": false,
"display_in_template_store": false,
"acquisition_source": "No touch",
"is_connector": false,
"show_connections": null,
"terms_of_service_url": "https://ganttgo.com/terms",
"available_for_tiers": [],
"available_for_products": [],
"google_analytics_tag_id": null,
"is_solution": false,
"cta_override": null,
"app_scope_str": "boards:read,me:read,boards:write",
"app_client_id": "5d4a5830847d6353bbc92cb33dd033a2",
"app_color": {
"hsl": {
"h": 198.232044198895,
"s": 1,
"l": 0.35490196078431374,
"a": 1
},
"hex": "#007eb5",
"rgb": {
"r": 0,
"g": 126,
"b": 181,
"a": 1
},
"hsv": {
"h": 198.232044198895,
"s": 1,
"v": 0.7098039215686275,
"a": 1
},
"oldHue": 347.36842105263156,
"source": "hex"
},
"plans": [
{
"id": "10730324-1-free",
"appPlanId": "free",
"name": "FREE",
"versionId": 1,
"isTrial": false,
"prices": {
"type": "standard",
"monthly": 0,
"yearly": 0
},
"versionState": "live",
"appId": 10730324,
"description": " Visualize your Monday board as a Gantt chart. Export up to 50 items to PDF. A4 paper size, dependencies, critical path, baseline comparison, all view modes. Includes GanttGo watermark. ",
"extraData": {
"bullets": [
"Upto 50 items",
"A4 paper size",
"Critical path visualization ",
"Baseline comparison ",
" PDF export with dependencies "
],
"monthlyFee": 0,
"yearlyFee": 0
},
"isFree": true,
"isRecommended": false,
"currency": "USD"
},
{
"id": "10730324-1-pro",
"appPlanId": "pro",
"name": "PRO",
"versionId": 1,
"isTrial": false,
"prices": {
"type": "standard",
"monthly": 12,
"yearly": 9
},
"versionState": "live",
"appId": 10730324,
"description": "Full Gantt export power. 1000 items, all paper sizes, no watermark, company logo. Critical path & baseline visualization. Schedule automatic exports and email PDF reports to your team. ",
"extraData": {
"bullets": [
"Upto 1000 items",
"All paper sizes( A4, A3, Letter, Legal)",
"No watermark",
"Company logo on exports",
"Auto-email PDF reports "
],
"monthlyFee": 12,
"yearlyFee": 9
},
"isFree": false,
"isRecommended": false,
"currency": "USD"
},
{
"id": "10730324-2-free",
"appPlanId": "free",
"name": "FREE",
"versionId": 2,
"isTrial": false,
"prices": {
"type": "standard",
"monthly": 0,
"yearly": 0
},
"versionState": "live",
"appId": 10730324,
"description": " Visualize your Monday board as a Gantt chart. Export up to 50 items to PDF. A4 paper size, dependencies, critical path, baseline comparison, all view modes. Includes GanttGo watermark. ",
"extraData": {
"bullets": [
"Upto 50 items",
"A4 paper size",
"Critical path visualization ",
"Baseline comparison ",
" PDF export with dependencies "
],
"monthlyFee": 0,
"yearlyFee": 0
},
"isFree": true,
"isRecommended": false,
"currency": "USD"
},
{
"id": "10730324-2-pro",
"appPlanId": "pro",
"name": "PRO",
"versionId": 2,
"isTrial": true,
"prices": {
"type": "standard",
"monthly": 12,
"yearly": 9
},
"versionState": "live",
"appId": 10730324,
"description": "Full Gantt export power. 1000 items, all paper sizes, no watermark, company logo. Critical path & baseline visualization. Schedule automatic exports and email PDF reports to your team. ",
"extraData": {
"bullets": [
"Upto 1000 items",
"All paper sizes( A4, A3, Letter, Legal)",
"No watermark",
"Company logo on exports",
"Auto-email PDF reports "
],
"monthlyFee": 12,
"yearlyFee": 9
},
"isFree": false,
"isRecommended": false,
"currency": "USD"
},
{
"id": "10730324-3-free",
"appPlanId": "free",
"name": "FREE",
"versionId": 3,
"isTrial": false,
"prices": {
"type": "standard",
"monthly": 0,
"yearly": 0
},
"versionState": "live",
"appId": 10730324,
"description": " Visualize your Monday board as a Gantt chart. Export up to 25 items to PDF. A4 paper size, dependencies, critical path, baseline comparison, all view modes. Includes GanttGo watermark. ",
"extraData": {
"bullets": [
"Upto 50 items",
"A4 paper size",
"Critical path visualization ",
"Baseline comparison ",
" PDF export with dependencies "
],
"monthlyFee": 0,
"yearlyFee": 0
},
"isFree": true,
"isRecommended": false,
"currency": "USD"
},
{
"id": "10730324-3-pro",
"appPlanId": "pro",
"name": "PRO",
"versionId": 3,
"isTrial": true,
"prices": {
"type": "standard",
"monthly": 12,
"yearly": 9
},
"versionState": "live",
"appId": 10730324,
"description": "Full Gantt export power. 1000 items, all paper sizes, no watermark, company logo. Critical path & baseline visualization. Schedule automatic exports and email PDF reports to your team. ",
"extraData": {
"bullets": [
"Upto 1000 items",
"All paper sizes( A4, A3, Letter, Legal)",
"No watermark",
"Company logo on exports",
"Auto-email PDF reports "
],
"monthlyFee": 12,
"yearlyFee": 9
},
"isFree": false,
"isRecommended": false,
"currency": "USD"
},
{
"id": "10730324-4-free",
"appPlanId": "free",
"name": "FREE",
"versionId": 4,
"isTrial": false,
"prices": {
"type": "standard",
"monthly": 0,
"yearly": 0
},
"versionState": "live",
"appId": 10730324,
"description": " Visualize your Monday board as a Gantt chart. Export up to 25 items to PDF. A4 paper size, dependencies, critical path, baseline comparison, all view modes. Includes GanttGo watermark. ",
"extraData": {
"bullets": [
"Upto 50 items",
"A4 paper size",
"Critical path visualization ",
"Baseline comparison ",
" PDF export with dependencies "
],
"monthlyFee": 0,
"yearlyFee": 0
},
"isFree": true,
"isRecommended": false,
"currency": "USD"
},
{
"id": "10730324-4-pro",
"appPlanId": "pro",
"name": "PRO",
"versionId": 4,
"isTrial": true,
"prices": {
"type": "standard",
"monthly": 12,
"yearly": 9
},
"versionState": "live",
"appId": 10730324,
"description": "Full Gantt export power. 1000 items, all paper sizes, no watermark, company logo. Critical path & baseline visualization. Schedule automatic exports and email PDF reports to your team. ",
"extraData": {
"bullets": [
"Upto 1000 items",
"All paper sizes( A4, A3, Letter, Legal)",
"No watermark",
"Company logo on exports",
"Auto-email PDF reports "
],
"monthlyFee": 12,
"yearlyFee": 9
},
"isFree": false,
"isRecommended": false,
"currency": "USD"
}
],
"app_live_version": {
"updated_at": "2026-03-31T19:55:27.495Z",
"id": 13774179
},
"pricing_model": null,
"monetization": {
"monetizationType": "monday",
"hasFreePlan": true,
"hasPaidPlan": true,
"hasTrialPlan": true
},
"badges_data": {
"security": false,
"app_values": [
"Easier resource management"
],
"acquisition_source": "No touch",
"display_in_template_store": false
},
"data": {
"is_solution": false,
"is_connector": false,
"available_for_tiers": [],
"terms_of_service_url": "https://ganttgo.com/terms",
"available_for_products": [],
"google_analytics_tag_id": null
},
"display": null,
"installsDelta": {
"totalInstalls": 99,
"sevenDays": 4,
"thirtyDays": 17,
"ninetyDays": 27
}
}