Funnels
2,278 installs, since February 2, 2021. 36 installs/month. Updated March 24, 2024.

Funnels and Tree/Journey diagrams for sales and marketing
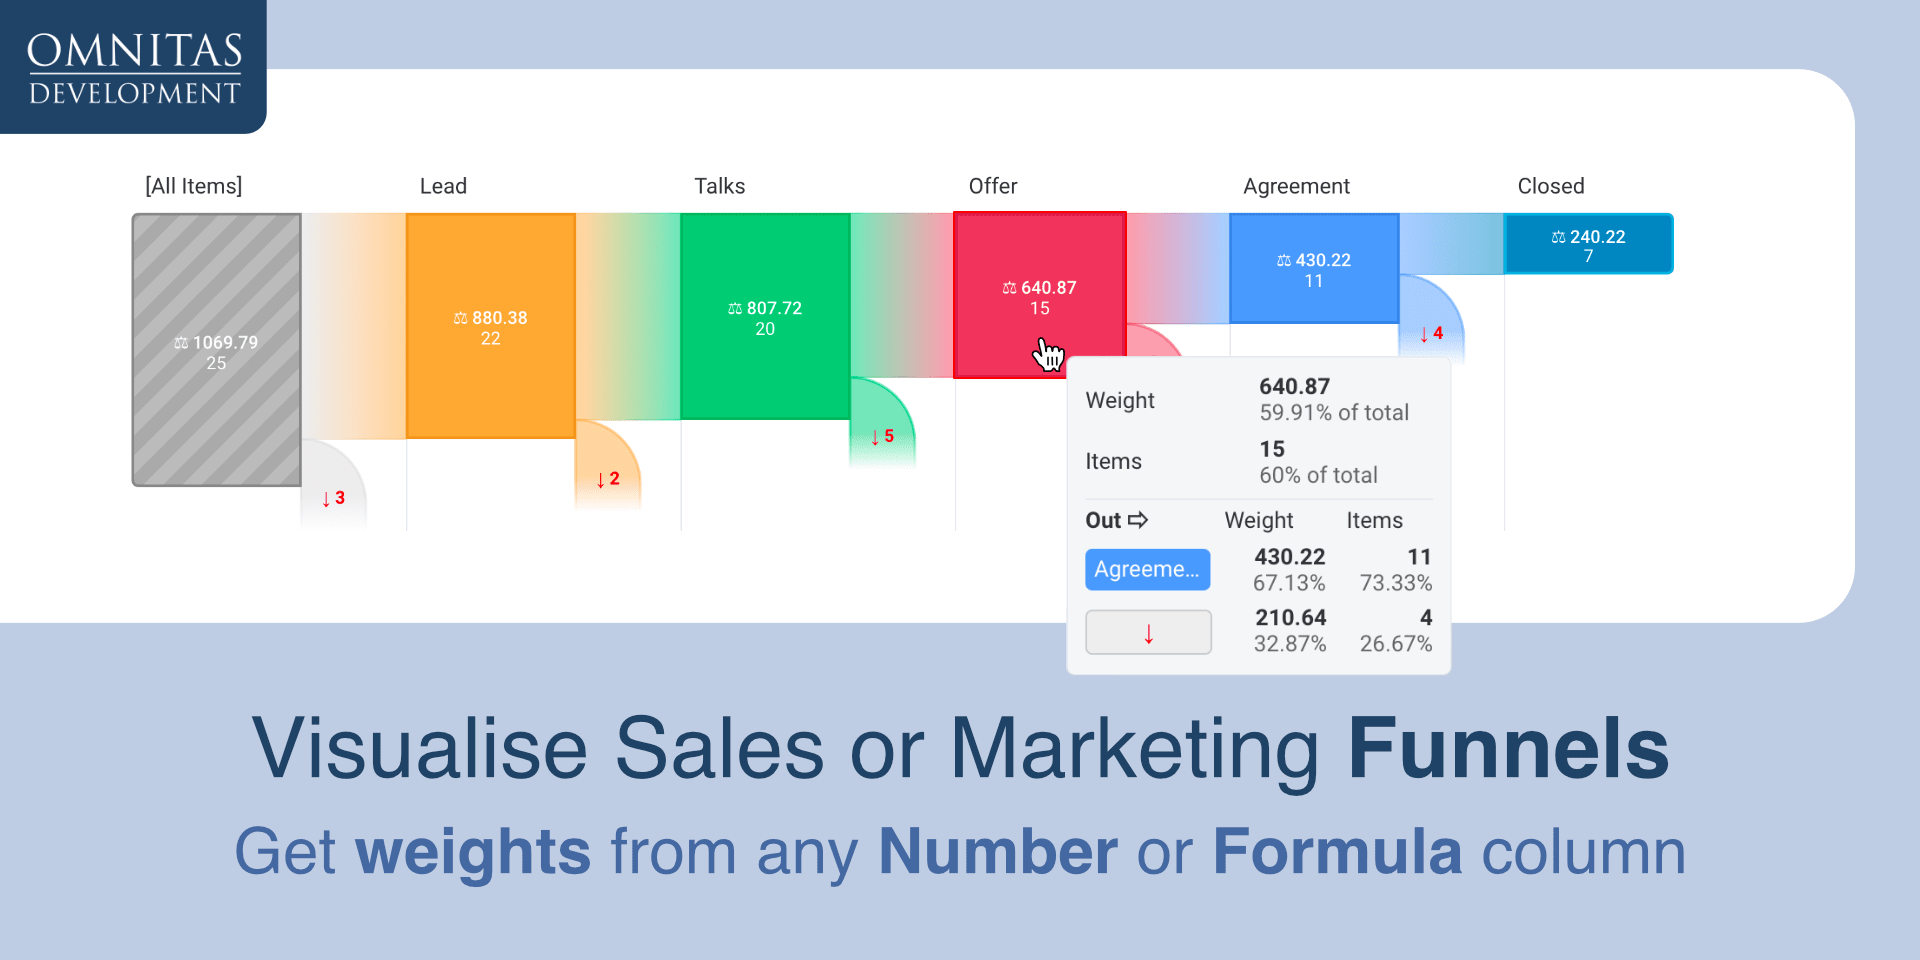
Board views to visualise sales or marketing funnels and journey of items through the workflow.
Example use cases:
- show percentage of items dropping out at every stage of the process
- compare conversion rates between different lead sources
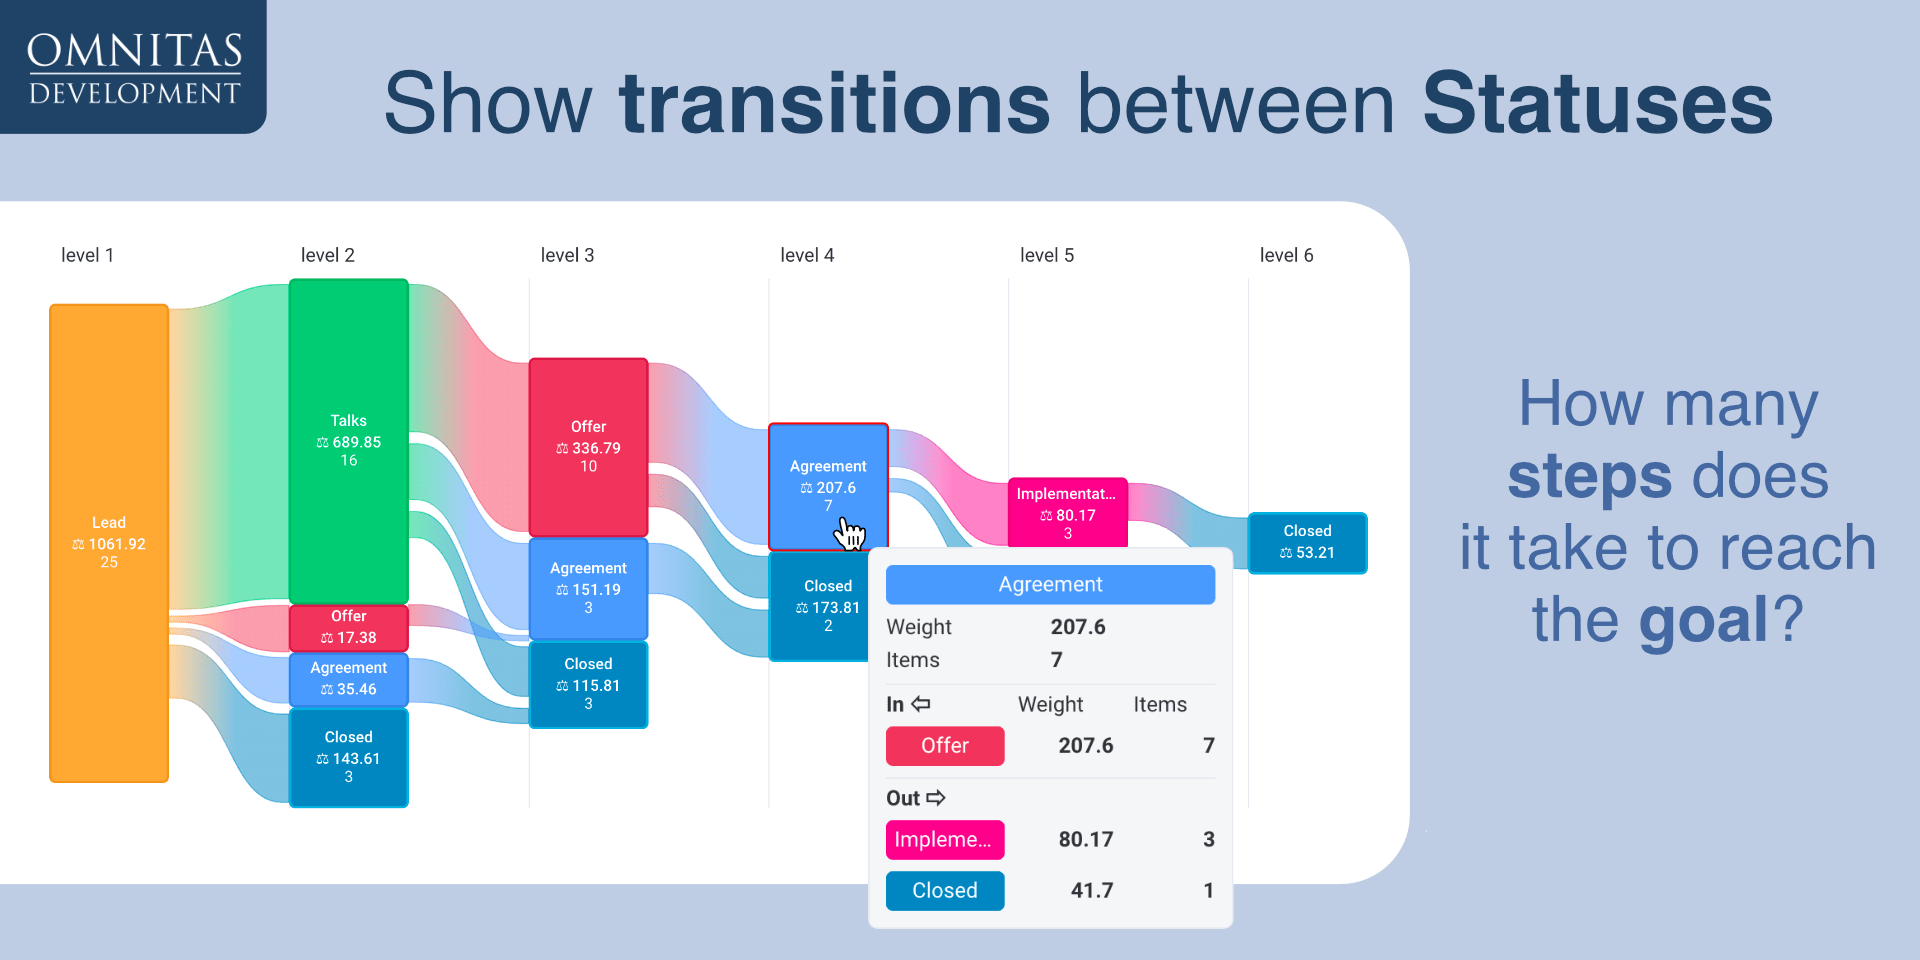
- find out how many steps are required to reach certain Status (e.g. close the sale)
- find bottlenecks in the process
Features:
- visualise funnels based on order of Statuses in your process
- visualise transitions of items across Statuses as Tree / Journey diagram
- use count of items or weight values to show relative size of nodes in diagrams (Number or Formula columns can be used to provide weights)
- drill down to show Status transitions of individual items
- customise graphs:
- drag and drop Statuses to change their default order
- show or hide any Statuses in the workflow
- use standard board Filters to filter out any items
- change scale of nodes - freely pan and zoom graphs
Security & Compliance
The app developer did not provide the security and compliance information for this app.
Reviews
No reviews yet.
Historical data
Installation history
We have data for December 28, 2024 onwards only. Collected sometime after 00:00 UTC daily.
Total number of installs
Change in total number of installs in last 1 day(s)
Compares the number of installs on each date with 1 days previously:
Change in total number of installs in last 7 day(s)
Compares the number of installs on each date with 7 days previously:
Change in total number of installs in last 30 day(s)
Compares the number of installs on each date with 30 days previously:
Change in total number of installs in last 90 day(s)
Compares the number of installs on each date with 90 days previously:
Change in total number of installs in last 180 day(s)
Compares the number of installs on each date with 180 days previously:
Ratings history
Categories history
Each of the following is a yes/no answer, so the graphs show 1 for yes, and 0 for no.