See your board's workload density as a calendar heatmap.
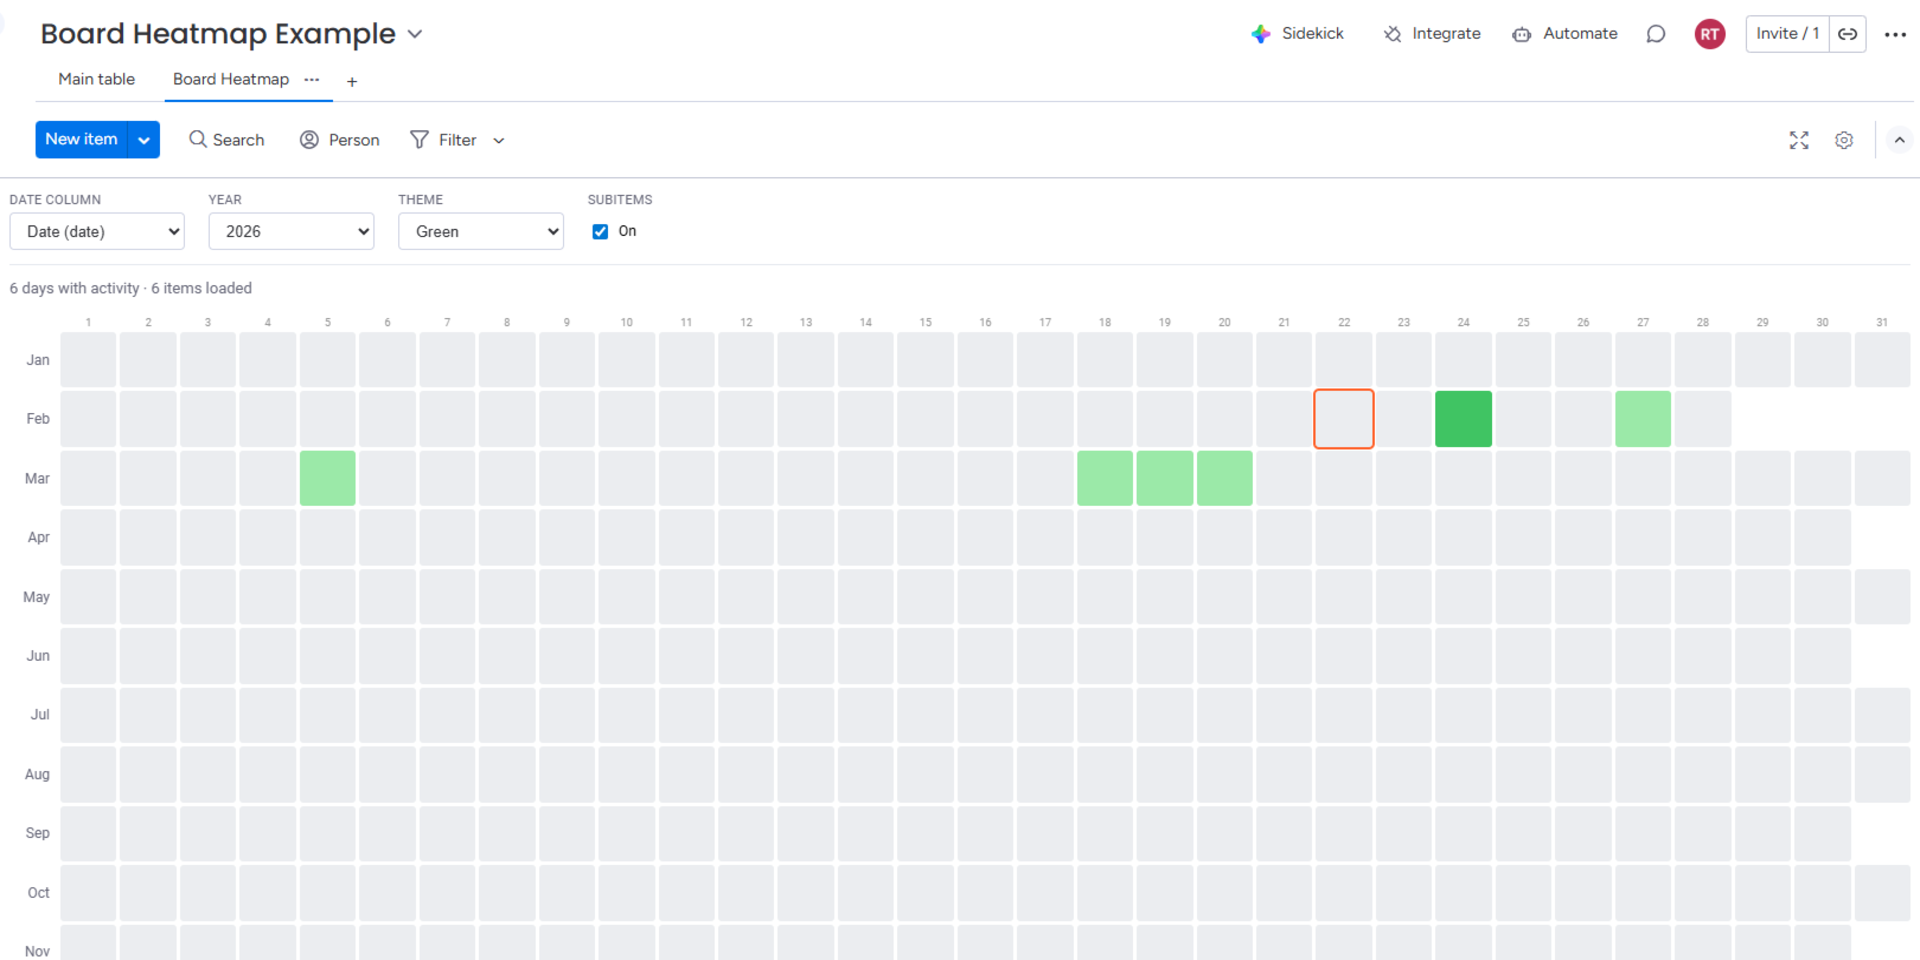
Board Heatmap turns your board data into a beautiful, interactive calendar heatmap — like GitHub's contribution graph, but for your monday.com projects.
Each day is a colored square. The darker the color, the more items are due that day. Instantly spot overloaded weeks, quiet periods, and workload patterns across your entire year.
Key Features:
- Visual workload density — See which days have the most items at a glance
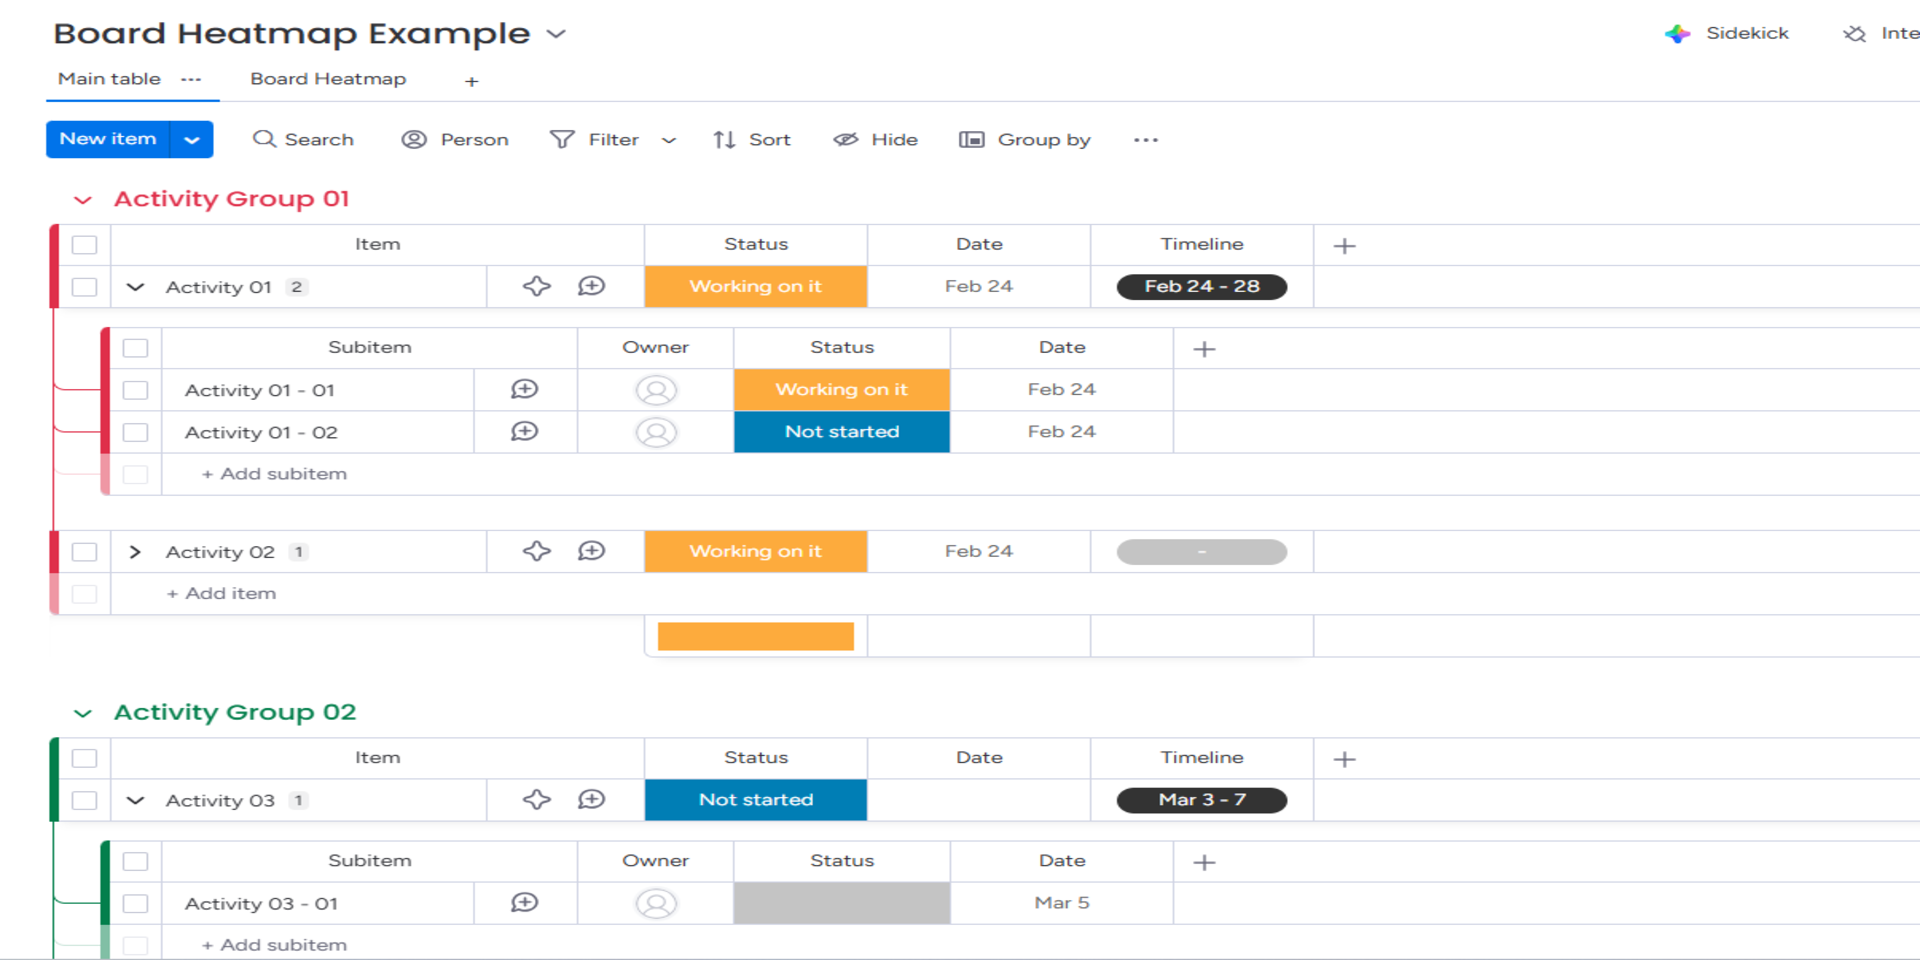
- Multiple date column support — Works with Date, Timeline, and Creation Log columns
- 4 color themes — Green, Blue, Orange, and Purple
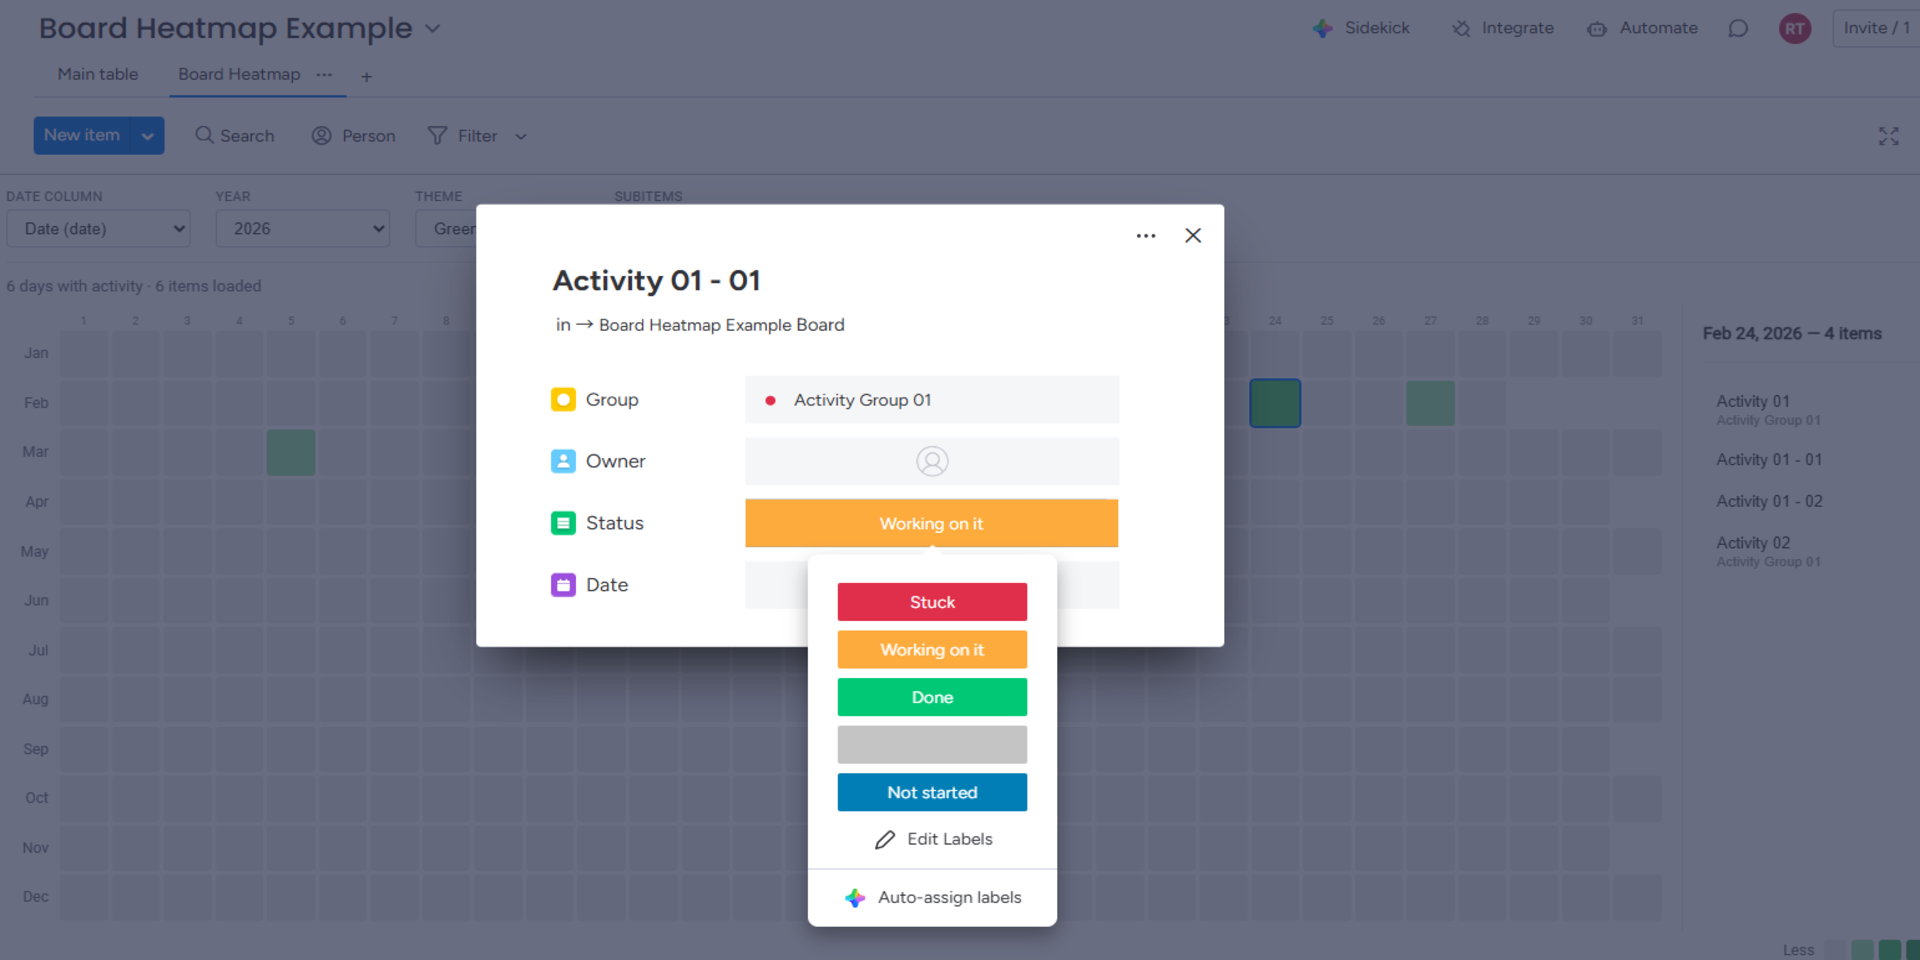
- Interactive day details — Click any day to see items, click an item to open it
- Subitems support — Include subitems in your density calculation
- Year navigation — Switch between years to compare patterns
- Today indicator — Orange outline highlights the current date
- Keyboard navigation — Arrow keys for fast exploration
- Settings saved per board — Your preferences load automatically
Perfect for project managers tracking delivery cadence, team leads balancing workload, and operations teams spotting bottleneck days.
Board Heatmap only requires read access to your board data. It does not modify, create, or delete any items.
Security & Compliance
The app developer did not provide the security and compliance information for this app.
Reviews
No reviews yet.
Historical data
Installation history
We have data for December 28, 2024 onwards only. Collected sometime after 00:00 UTC daily.
Total number of installs
Change in total number of installs in last 1 day(s)
Compares the number of installs on each date with 1 days previously:
Max
Min
Current
Change in total number of installs in last 7 day(s)
Compares the number of installs on each date with 7 days previously:
Max
Min
Current
Change in total number of installs in last 30 day(s)
Compares the number of installs on each date with 30 days previously:
Max
Min
Current
Change in total number of installs in last 90 day(s)
Compares the number of installs on each date with 90 days previously:
Max
Min
Current
Change in total number of installs in last 180 day(s)
Compares the number of installs on each date with 180 days previously:
Max
Min
Current
Ratings history
Categories history
Each of the following is a yes/no answer, so the graphs show 1 for yes, and 0 for no.
{
"id": 10001110,
"marketplace_developer_id": 100000179,
"app_id": 10922804,
"app_type": "app",
"security_info": {},
"gallery_assets": [
{
"url": "https://cdn.monday.com/marketplace/10001110/10001110_2026_2_16_9_12_6_2kpwuy5.png",
"type": "image"
},
{
"url": "https://cdn.monday.com/marketplace/10001110/10001110_2026_2_16_9_12_9_kh457v9.png",
"type": "image"
},
{
"url": "https://cdn.monday.com/marketplace/10001110/10001110_2026_2_16_9_12_13_bo1h46u.png",
"type": "image"
}
],
"description": "<p>Board Heatmap turns your board data into a beautiful, interactive calendar heatmap — like GitHub's contribution graph, but for your <a href=\"http://monday.com/\" rel=\"noopener noreferrer\" target=\"_blank\">monday.com</a> projects.</p><p>Each day is a colored square. The darker the color, the more items are due that day. Instantly spot overloaded weeks, quiet periods, and workload patterns across your entire year.</p><p>Key Features:</p><p>- Visual workload density — See which days have the most items at a glance</p><p>- Multiple date column support — Works with Date, Timeline, and Creation Log columns</p><p>- 4 color themes — Green, Blue, Orange, and Purple</p><p>- Interactive day details — Click any day to see items, click an item to open it</p><p>- Subitems support — Include subitems in your density calculation</p><p>- Year navigation — Switch between years to compare patterns</p><p>- Today indicator — Orange outline highlights the current date</p><p>- Keyboard navigation — Arrow keys for fast exploration</p><p>- Settings saved per board — Your preferences load automatically</p><p>Perfect for project managers tracking delivery cadence, team leads balancing workload, and operations teams spotting bottleneck days.</p><p>Board Heatmap only requires read access to your board data. It does not modify, create, or delete any items.</p>",
"short_description": "See your board's workload density as a calendar heatmap.",
"thumbnail_url": "https://cdn.monday.com/marketplace/10001110/10001110_2026_2_16_9_11_50_6s83vzx.png",
"logo_url": "https://cdn.monday.com/marketplace/10001110/10001110_2026_2_16_9_11_47_nebzc85.png",
"feedback_url": "support@elephatech.com",
"privacy_policy_url": "https://elephatech.com/privacy",
"featured": false,
"name": "Board Heatmap",
"how_to_use_url": "https://elephatech.com/board-heatmap/how-to-use",
"external_pricing_url": null,
"keywords": "planning,board view,density,overview,timeline,date,workload,visualization,calendar,heatmap",
"compliance_answers": [],
"created_at": "2026-03-16T09:11:25.729Z",
"updated_at": "2026-03-16T09:12:15.451Z",
"automation_app_id": null,
"marketplace_category_ids": [],
"pinned_for_categories_ids": [],
"featured_for_categories_ids": [],
"pricing_data": null,
"label": null,
"app_values": null,
"security": false,
"display_in_template_store": false,
"acquisition_source": "No touch",
"is_connector": false,
"terms_of_service_url": "https://elephatech.com/terms",
"available_for_tiers": [],
"available_for_products": [],
"google_analytics_tag_id": null,
"is_solution": false,
"app_scope_str": "boards:read,users:read",
"app_client_id": "0b2e302eed243521432961eba02e29bd",
"app_color": "#e2445c",
"plans": null,
"app_live_version": {
"updated_at": "2026-03-16T11:26:33.544Z",
"id": 13448004
},
"pricing_model": null,
"badges_data": {
"security": false,
"acquisition_source": "No touch",
"display_in_template_store": false
},
"data": {
"is_connector": false,
"google_analytics_tag_id": null,
"is_solution": false,
"terms_of_service_url": "https://elephatech.com/terms",
"available_for_tiers": [],
"available_for_products": []
},
"display": null,
"installsDelta": {
"totalInstalls": 4
}
}