
Item Map Visualization Tool
23 installs, since February 3, 2026. 11 installs/month. Updated March 9, 2026.
Map Visualization for Your Locations in Item Card View
A simple way to see your item-level locations on a map. If you manage many items with location data, this app provides a straightforward, interactive map to help you visualize your location and country columns.
Features:
- Automatic Mapping: The app is designed to find your location columns and place them on the map for you automatically.
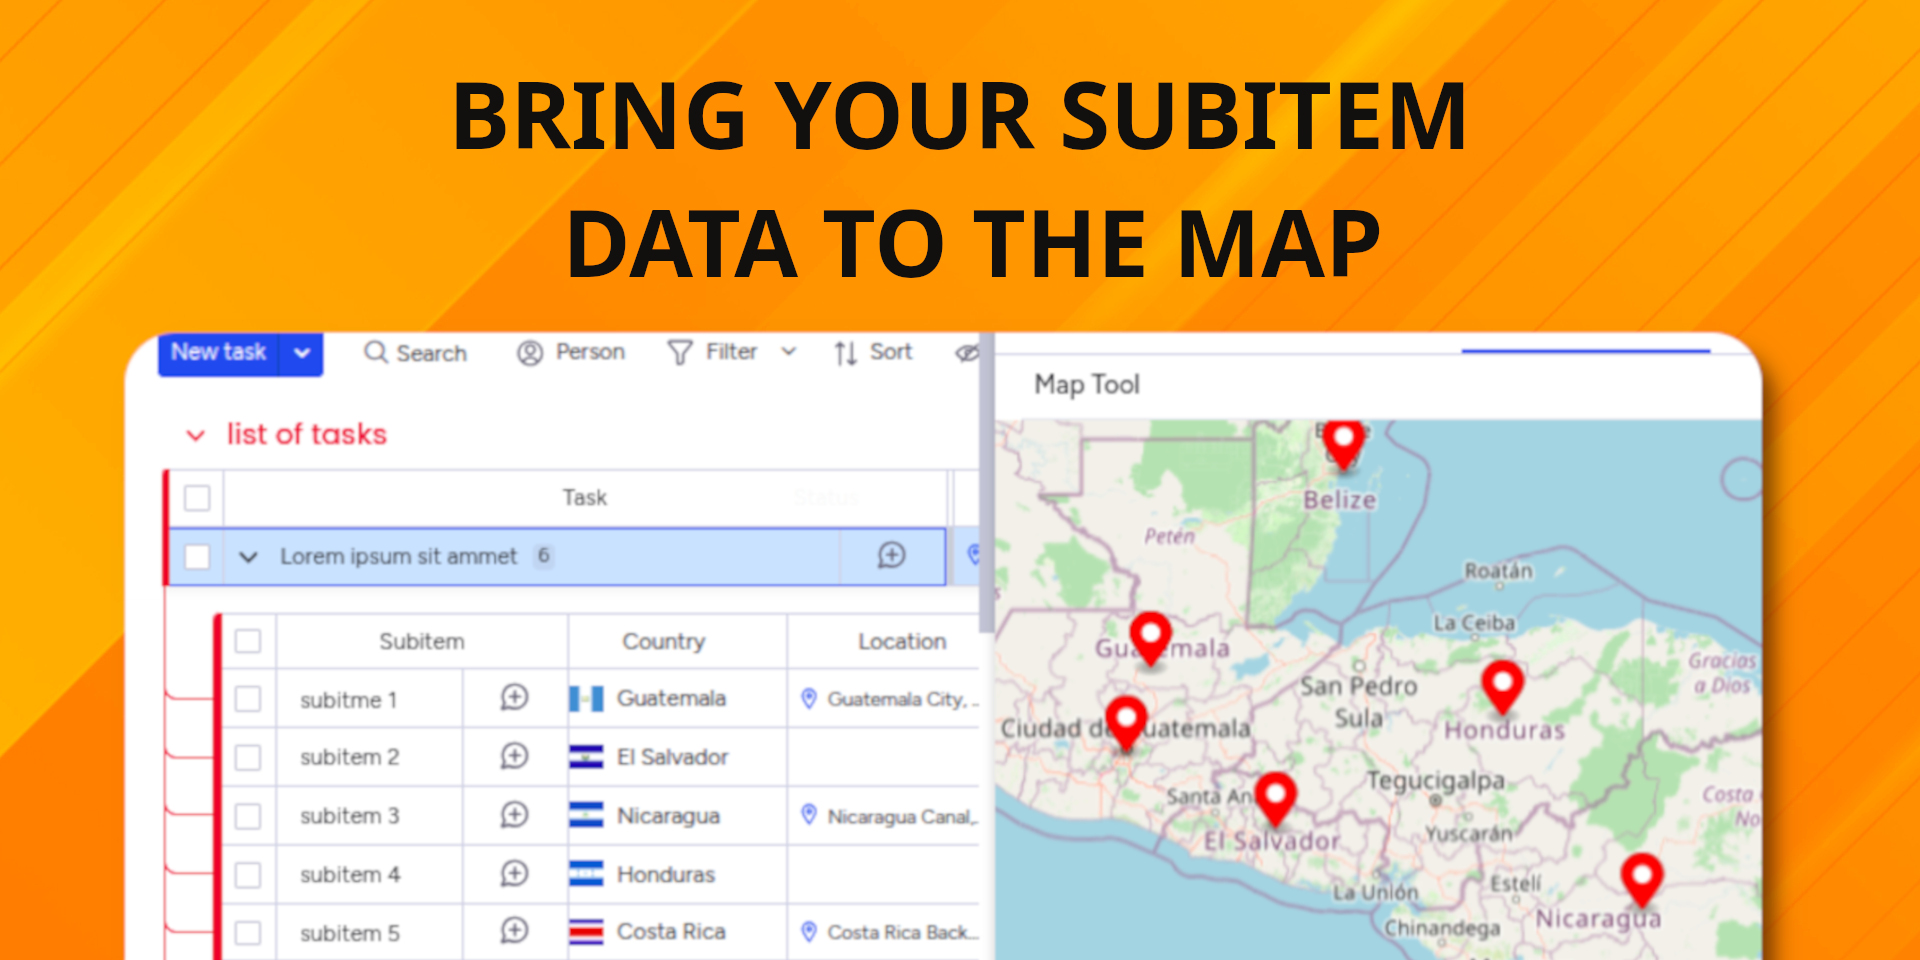
- Support for Subitems: The map is not limited to top-level items, it fully supports and displays locations at the subitem level.
- Displays Multiple Locations: If your item has more than one location column, the map will show all of them at once without requiring you to switch views.
- Straightforward Editing: If you see something that needs changing, just click a marker. It opens the item card right away so you can check details or make a quick update.
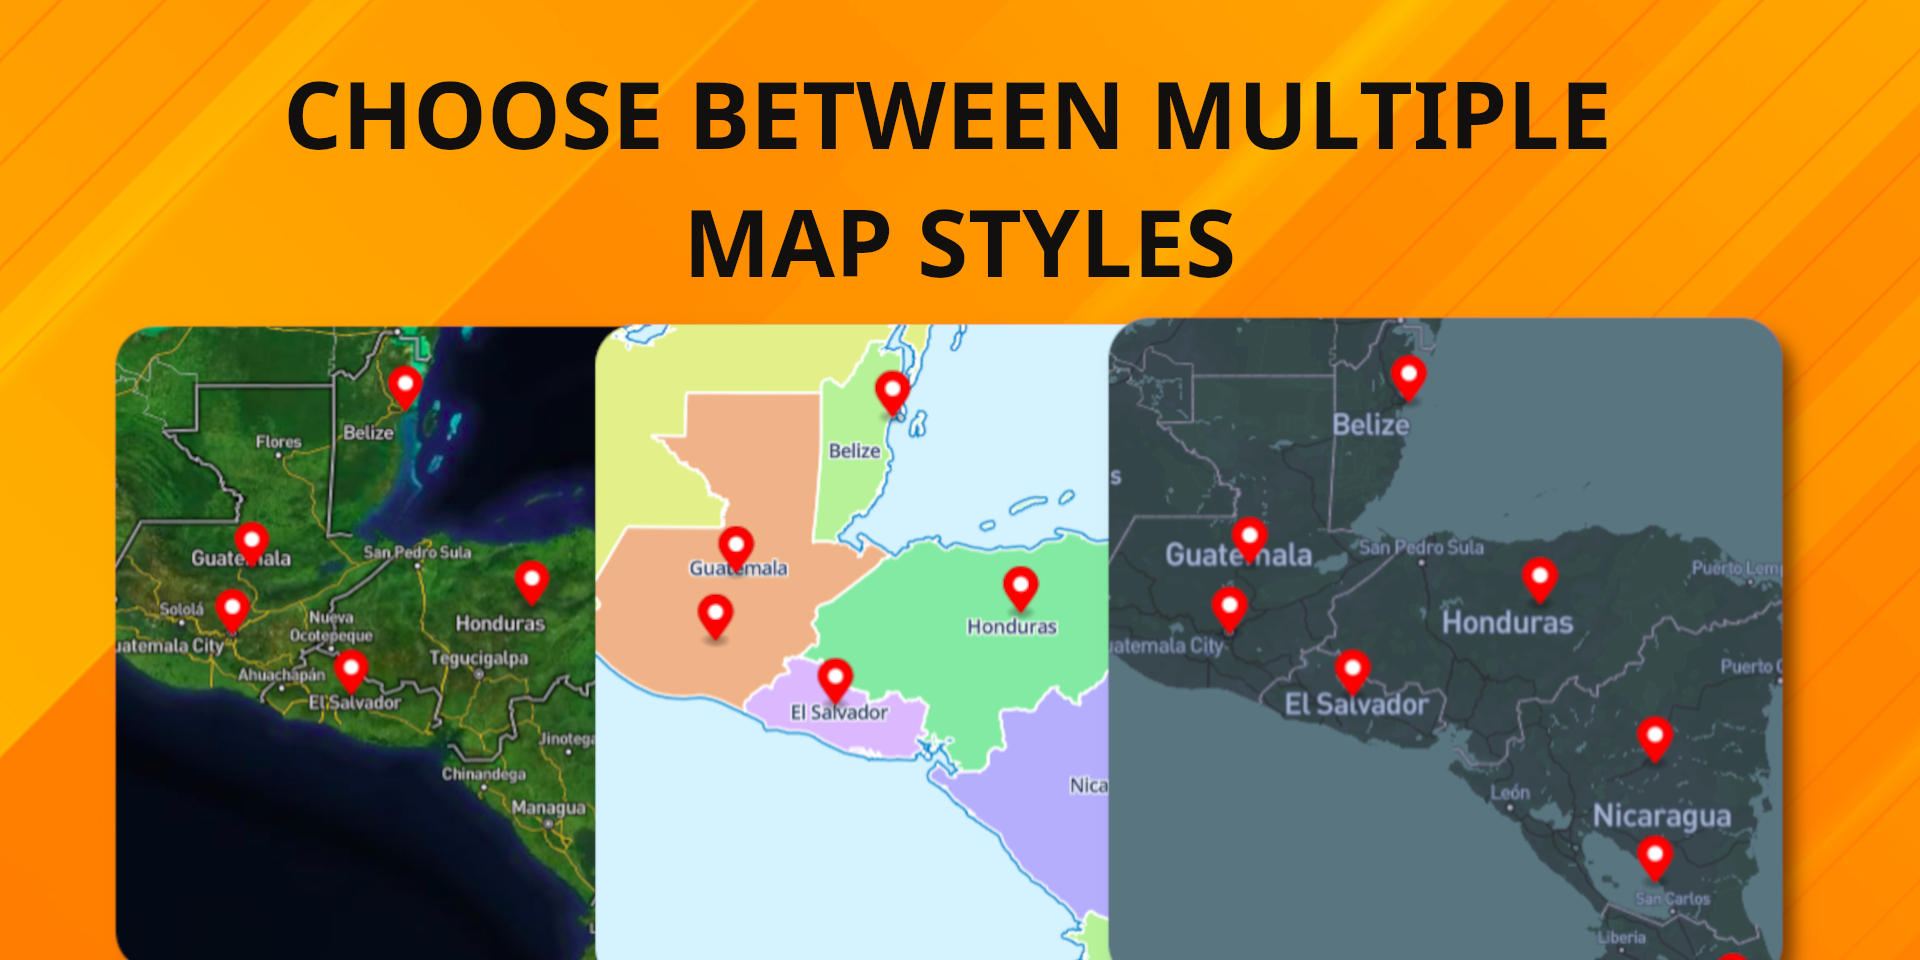
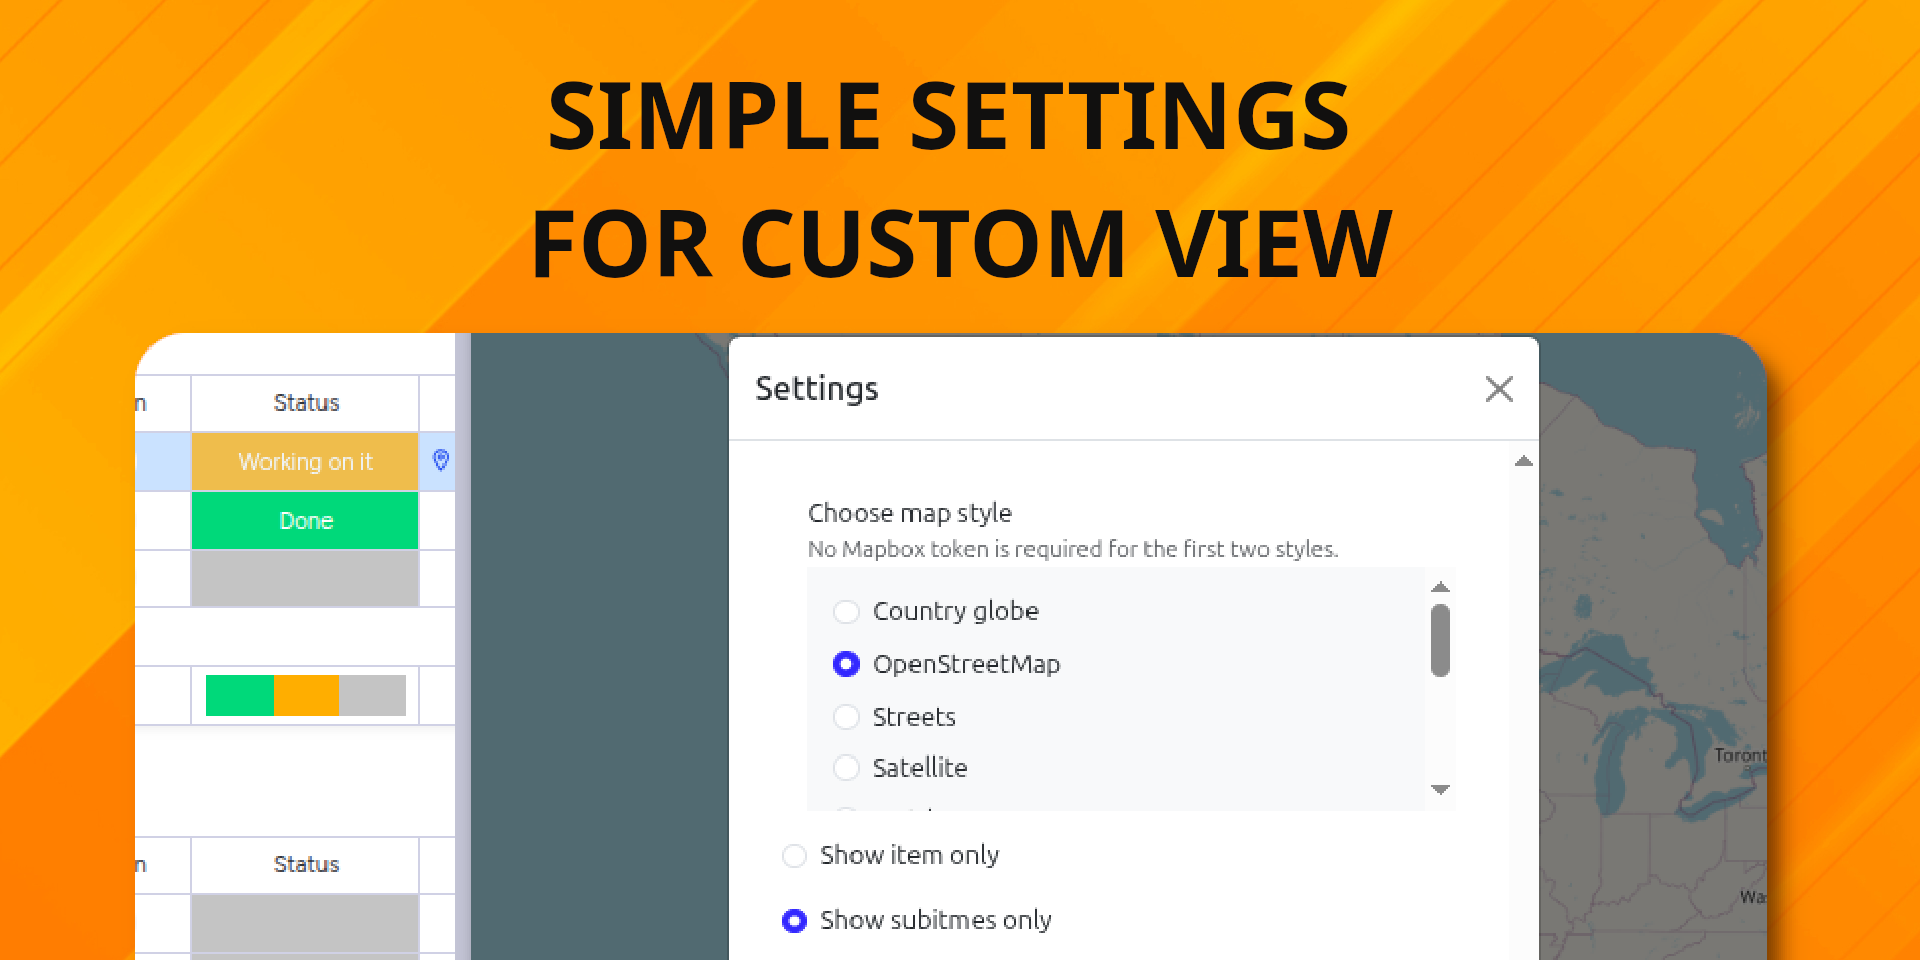
- Visual Options: You can choose from several different map styles to find the one that is most comfortable for you.
- Optional Customization: If you prefer specific map looks, you can bring your own Mapbox token to unlock further styles.
This is a completely free tool, designed to be "plug-and-play" with very little configuration required from your side. See how it works here!
Security & Compliance
The app developer did not provide the security and compliance information for this app.
Reviews
No reviews yet.
Historical data
Installation history
We have data for December 28, 2024 onwards only. Collected sometime after 00:00 UTC daily.
Total number of installs
Change in total number of installs in last 1 day(s)
Compares the number of installs on each date with 1 days previously:
Change in total number of installs in last 7 day(s)
Compares the number of installs on each date with 7 days previously:
Change in total number of installs in last 30 day(s)
Compares the number of installs on each date with 30 days previously:
Change in total number of installs in last 90 day(s)
Compares the number of installs on each date with 90 days previously:
Change in total number of installs in last 180 day(s)
Compares the number of installs on each date with 180 days previously:
Ratings history
Categories history
Each of the following is a yes/no answer, so the graphs show 1 for yes, and 0 for no.