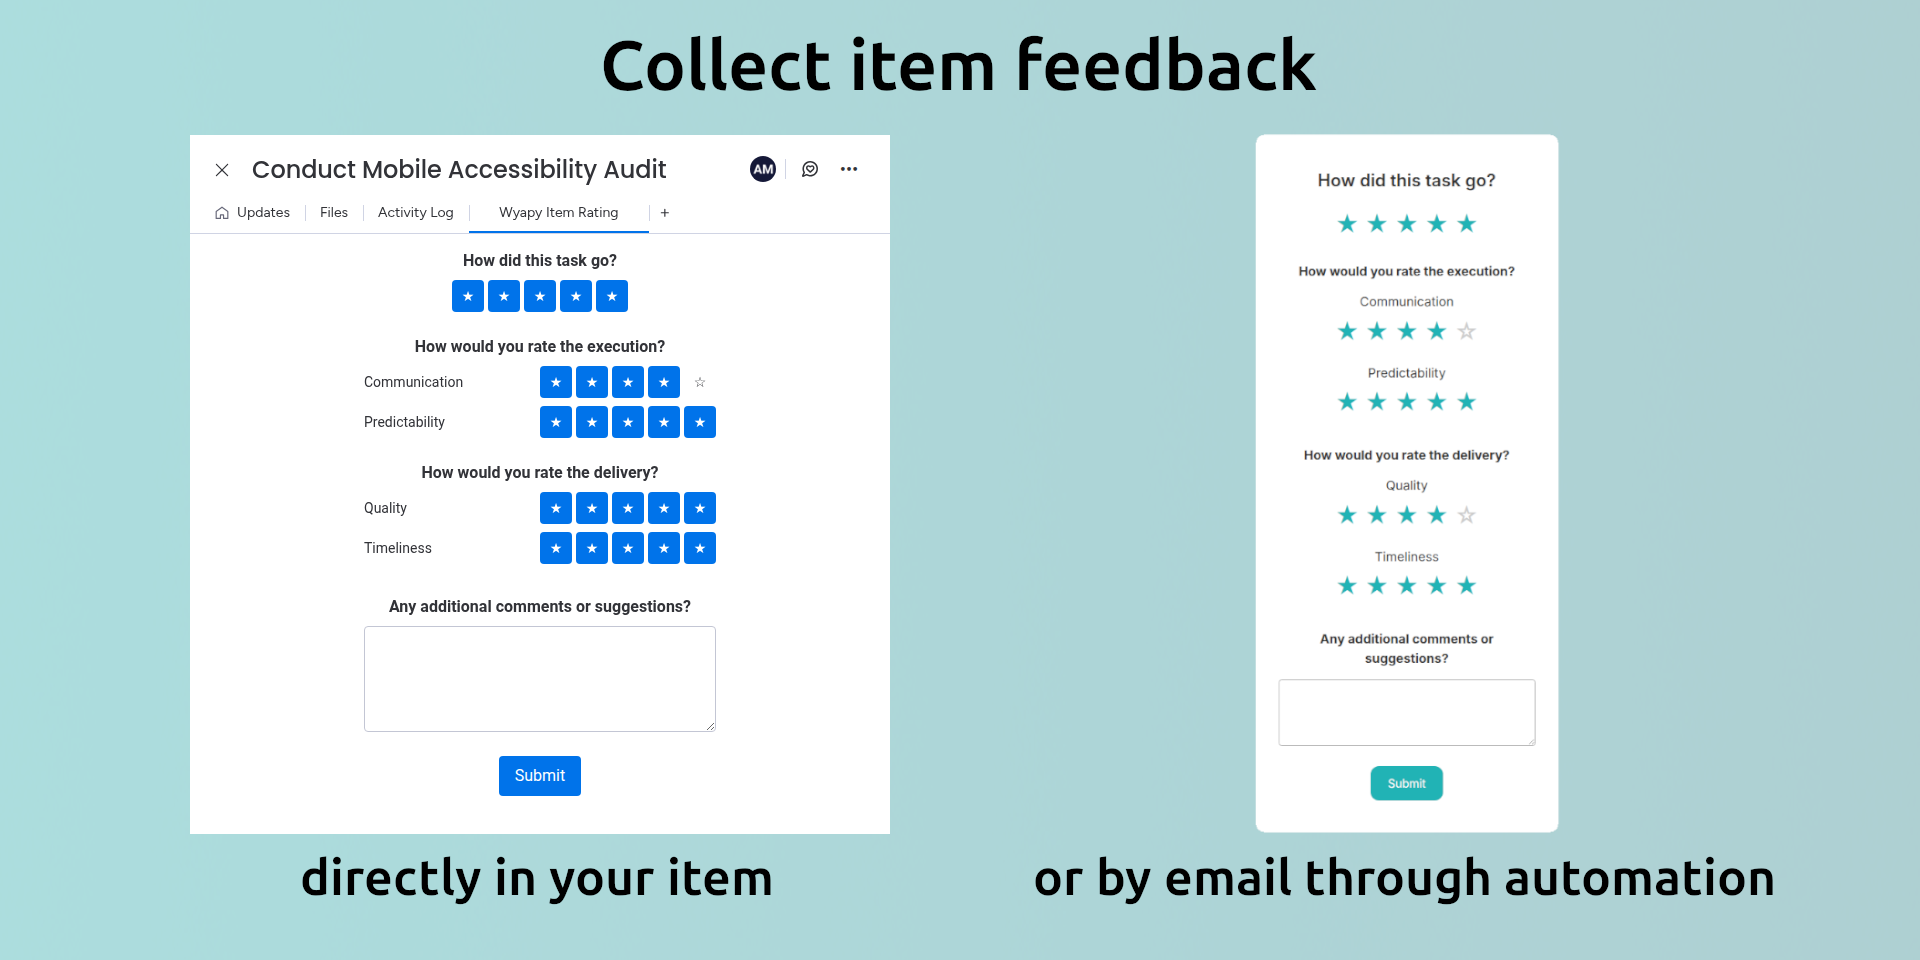
Wyapy for monday.com lets teams provide structured feedback for items, either directly inside monday boards or from external users.
Use it for customer satisfaction, internal reviews, or generic item feedback, then analyze trends across boards with dashboards and AI-generated reports.
You can capture feedback when work is completed, during key workflow steps, or by sending external feedback requests by email. All ratings are centralized and comparable across boards.
What you get
Provide item feedback directly from monday boards or request feedback from external users
Trigger feedback requests using monday automations (for example on Status change)
Support for CSAT, NPS, CES, or generic rating scales
Gather comments alongside ratings
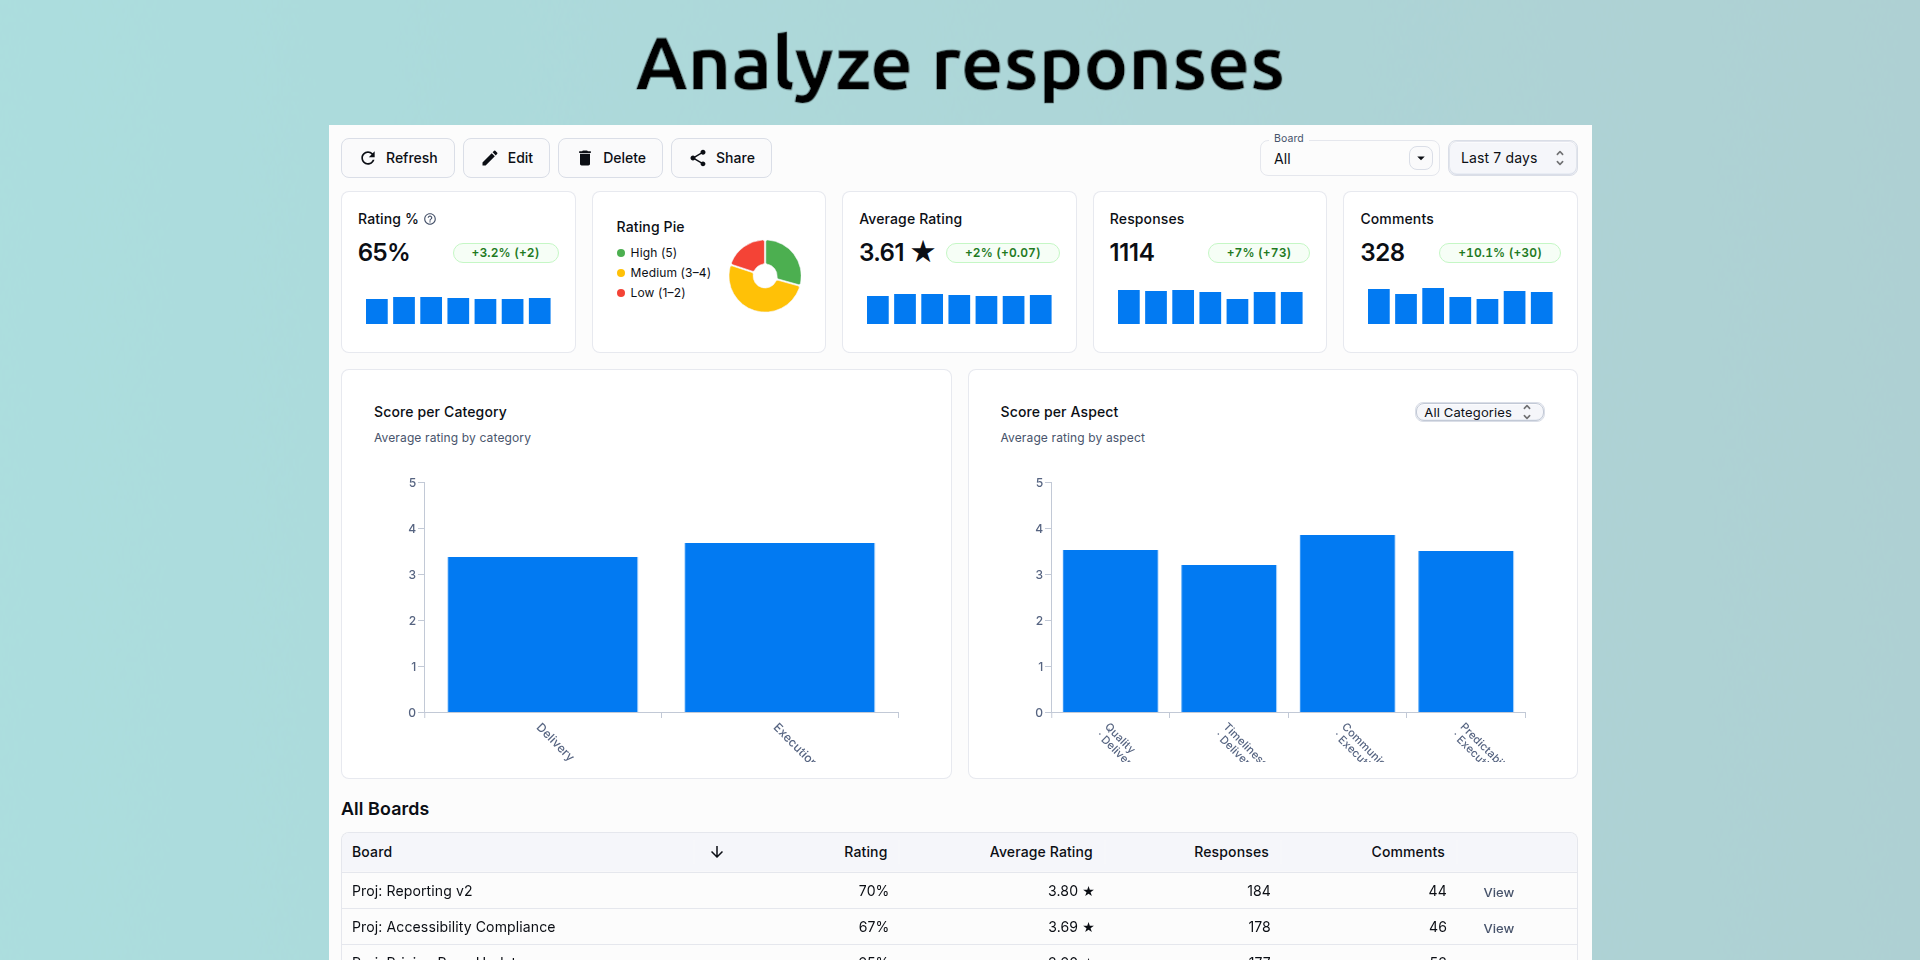
Segment and compare results by board to spot differences and trends
Push primary rating and comment into monday columns
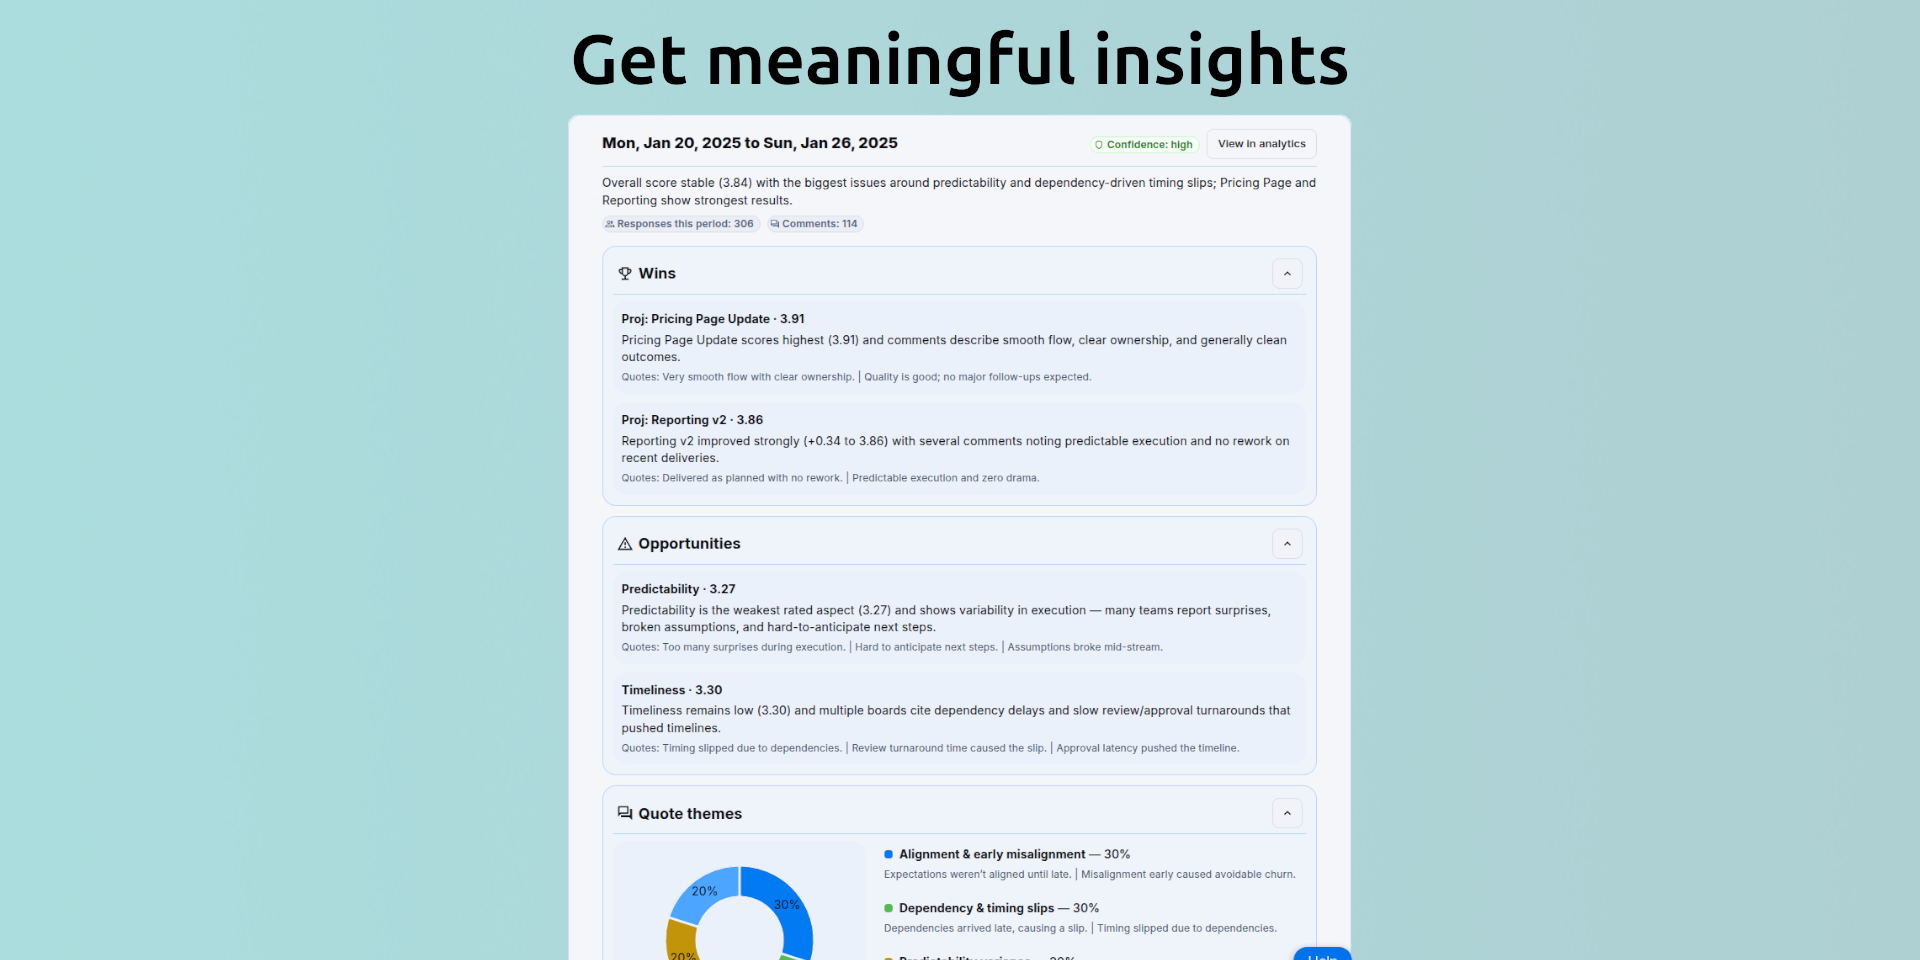
Dashboards with aggregated metrics and AI-generated reports that add context
Problems we solve
Collect structured feedback without building custom workflows
Centralize satisfaction and quality signals next to the work
Compare performance across boards, teams, or projects
Turn raw scores into understandable insights with AI summaries
Examples and use cases
Rate completed items directly from the board for internal quality reviews
Send a CSAT or NPS request to a customer when an item is marked Done
Collect effort or satisfaction scores after onboarding or delivery milestones
Compare ratings across boards to identify strong and weak areas
Review AI-generated summaries during weekly or monthly reviews
Data retention
After the app is uninstalled, your data may be kept for up to 10 days before being permanently deleted.
If you reinstall the app within this period, your data will be restored.
Security & Compliance
The app developer did not provide the security and compliance information for this app.
Reviews
No reviews yet.
Historical data
Installation history
We have data for December 28, 2024 onwards only. Collected sometime after 00:00 UTC daily.
Total number of installs
Change in total number of installs in last 1 day(s)
Compares the number of installs on each date with 1 days previously:
Max
Min
Current
Change in total number of installs in last 7 day(s)
Compares the number of installs on each date with 7 days previously:
Max
Min
Current
Change in total number of installs in last 30 day(s)
Compares the number of installs on each date with 30 days previously:
Max
Min
Current
Change in total number of installs in last 90 day(s)
Compares the number of installs on each date with 90 days previously:
Max
Min
Current
Change in total number of installs in last 180 day(s)
Compares the number of installs on each date with 180 days previously:
Max
Min
Current
Ratings history
Categories history
Each of the following is a yes/no answer, so the graphs show 1 for yes, and 0 for no.