Burndown Chart App
3,628 installs, since February 2, 2021. 58 installs/month. Updated March 24, 2024.
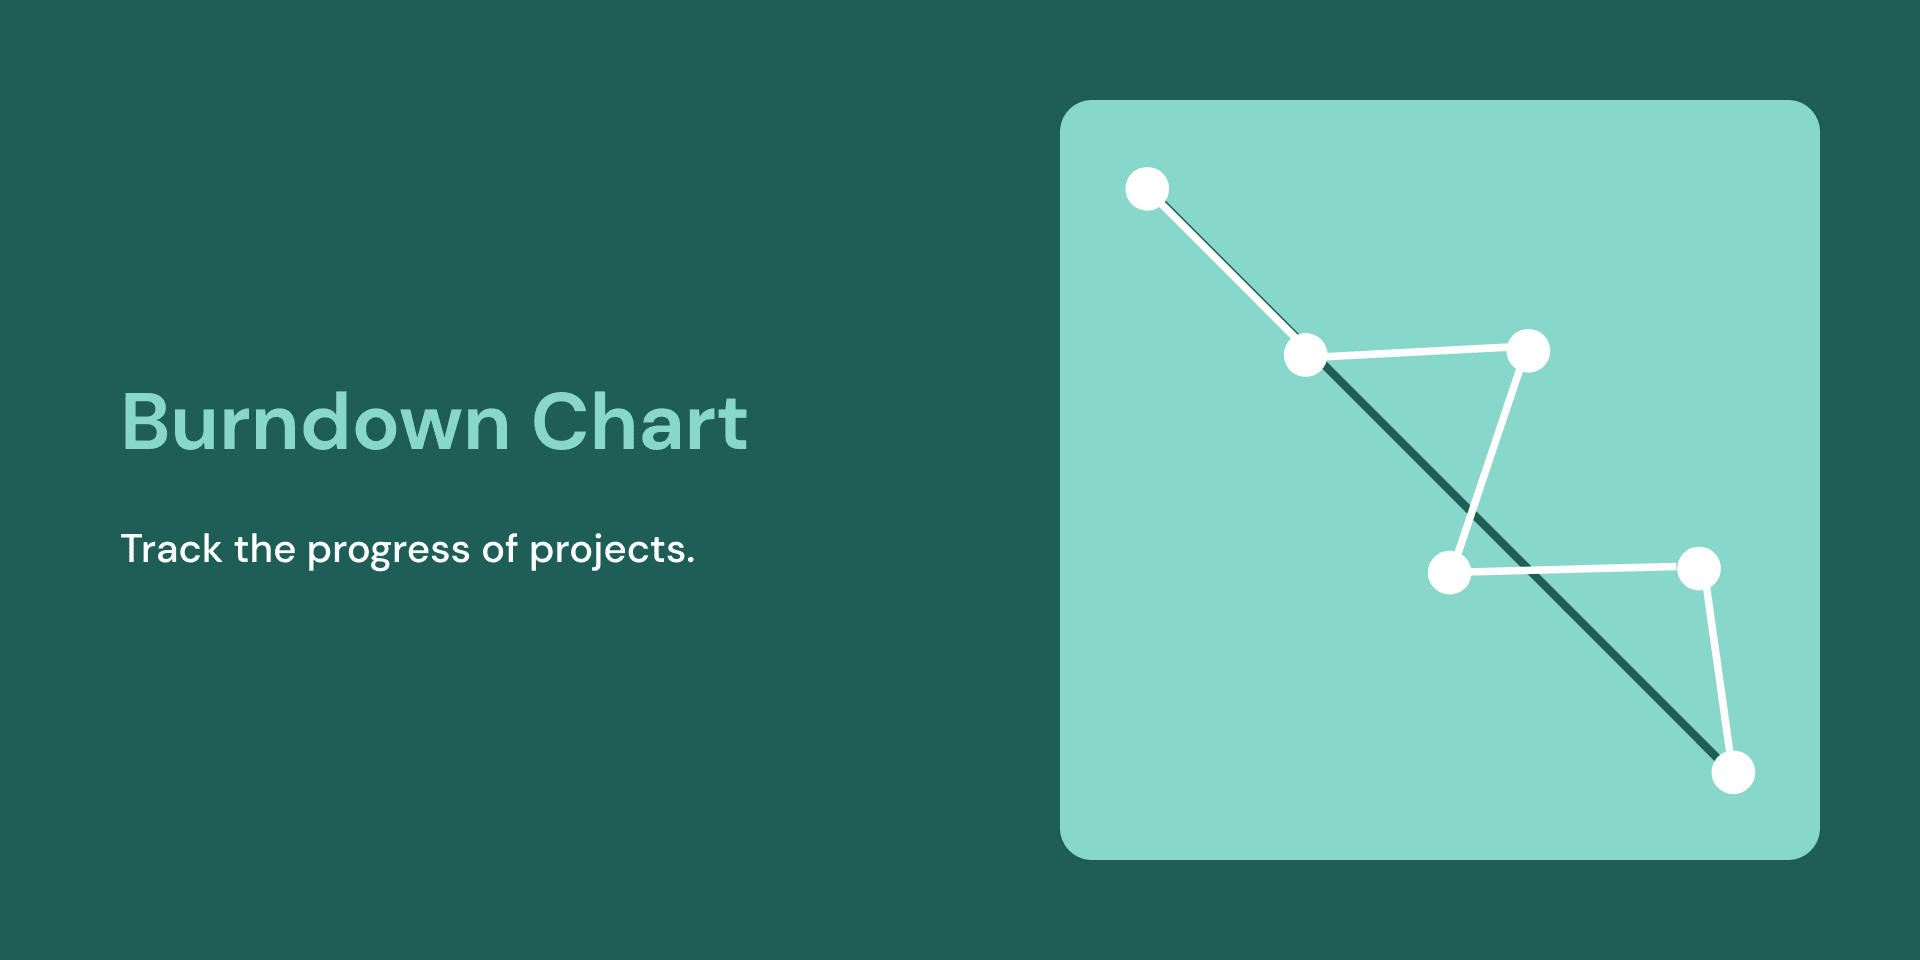
A simple & powerful way to manage and overview projects.
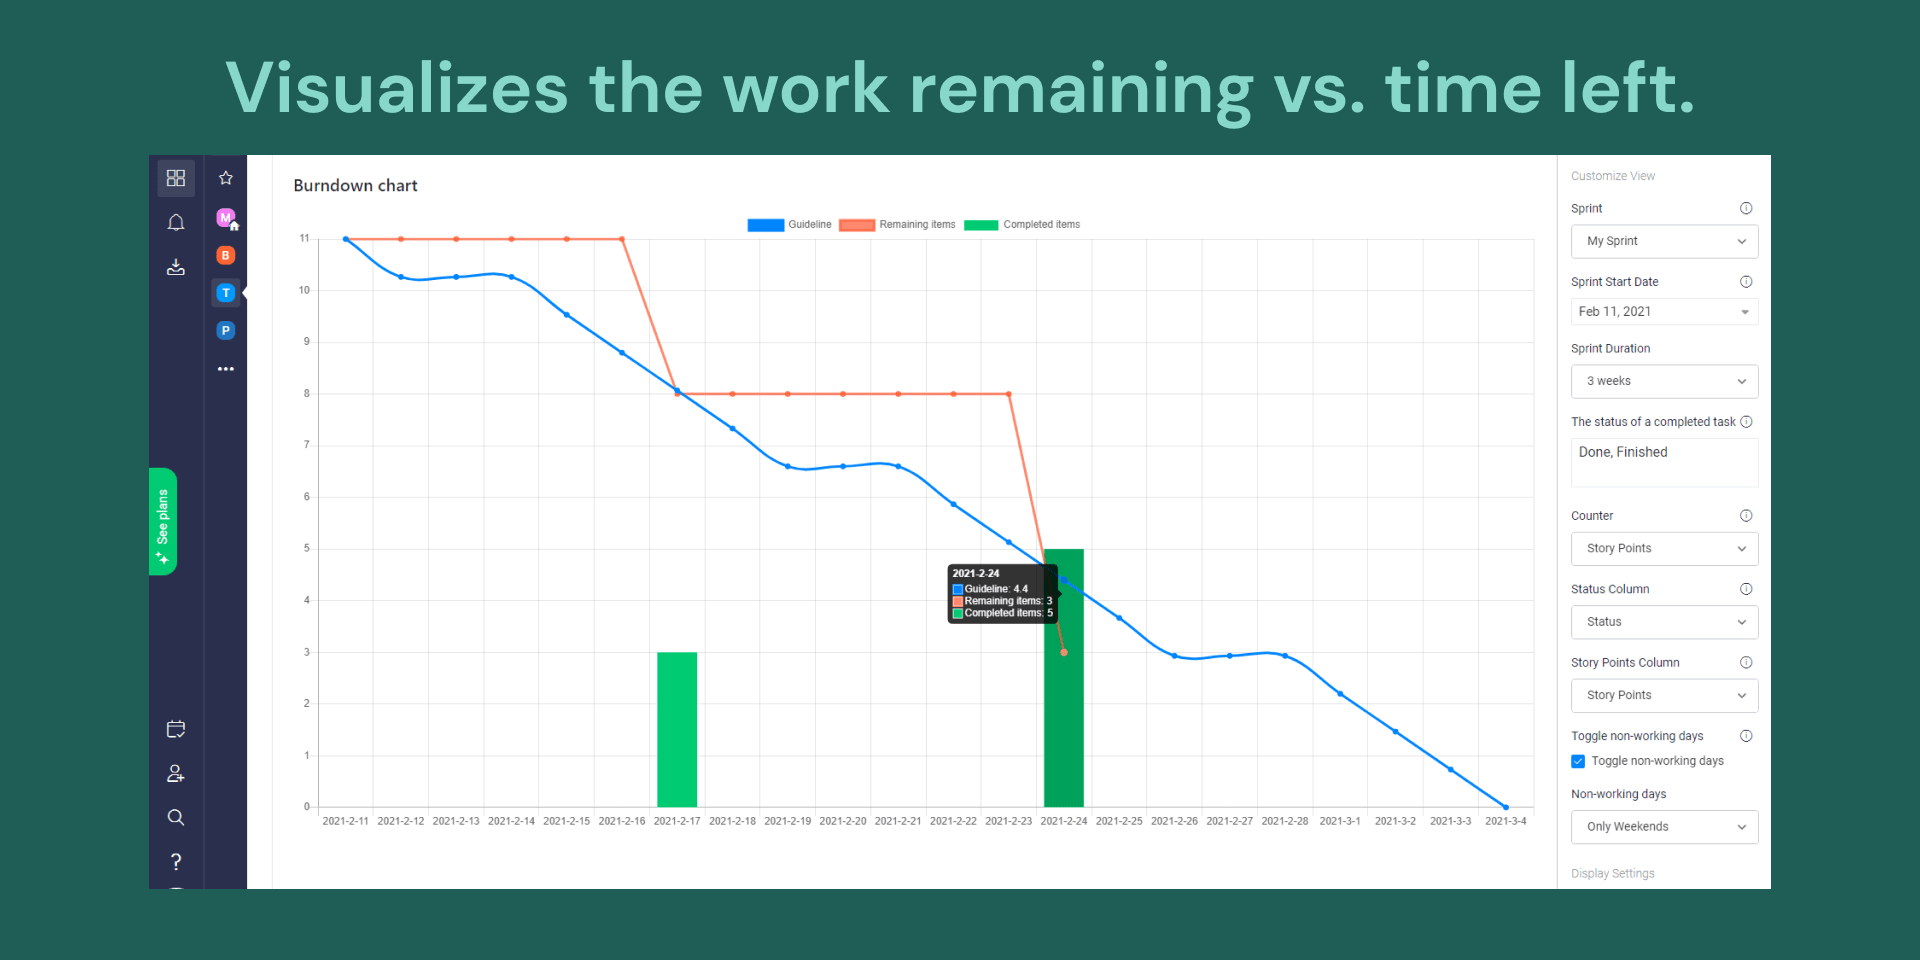
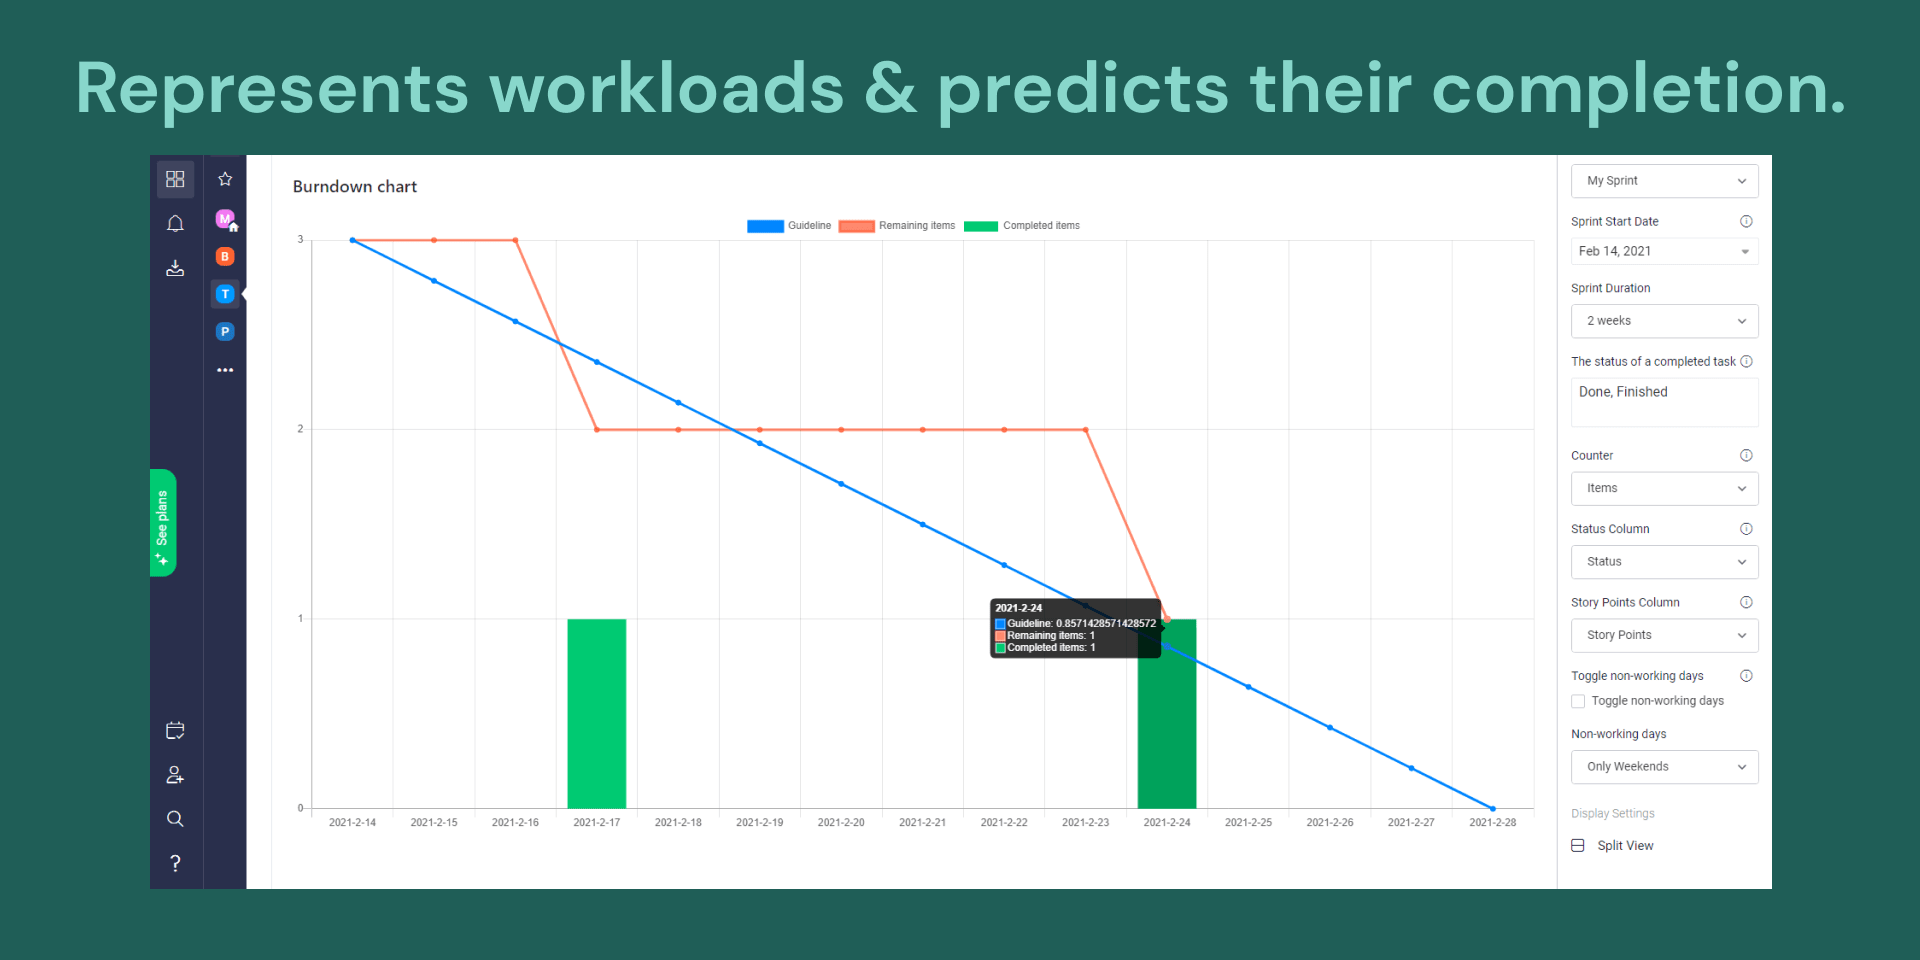
A burndown chart shows the amount of work that has been completed in an epic or sprint, and the total work remaining. The Burndown Chart App makes it possible to reflect your team's work in a chart view and makes it possible to see a chart by points/items.
The app helps you to:
- notice that the team finishes work earlier
- see if they are missing timelines as an indication of too much work within one sprint
- see a sharp drop during the sprint, this might be a sign that work has not been estimated accurately, or broken down properly
Security & Compliance
The app developer did not provide the security and compliance information for this app.
Reviews
MS: The documentation doesn't work, and neither does the app.
Historical data
Installation history
We have data for December 28, 2024 onwards only. Collected sometime after 00:00 UTC daily.
Total number of installs
Change in total number of installs in last 1 day(s)
Compares the number of installs on each date with 1 days previously:
Change in total number of installs in last 7 day(s)
Compares the number of installs on each date with 7 days previously:
Change in total number of installs in last 30 day(s)
Compares the number of installs on each date with 30 days previously:
Change in total number of installs in last 90 day(s)
Compares the number of installs on each date with 90 days previously:
Change in total number of installs in last 180 day(s)
Compares the number of installs on each date with 180 days previously:
Ratings history
Categories history
Each of the following is a yes/no answer, so the graphs show 1 for yes, and 0 for no.