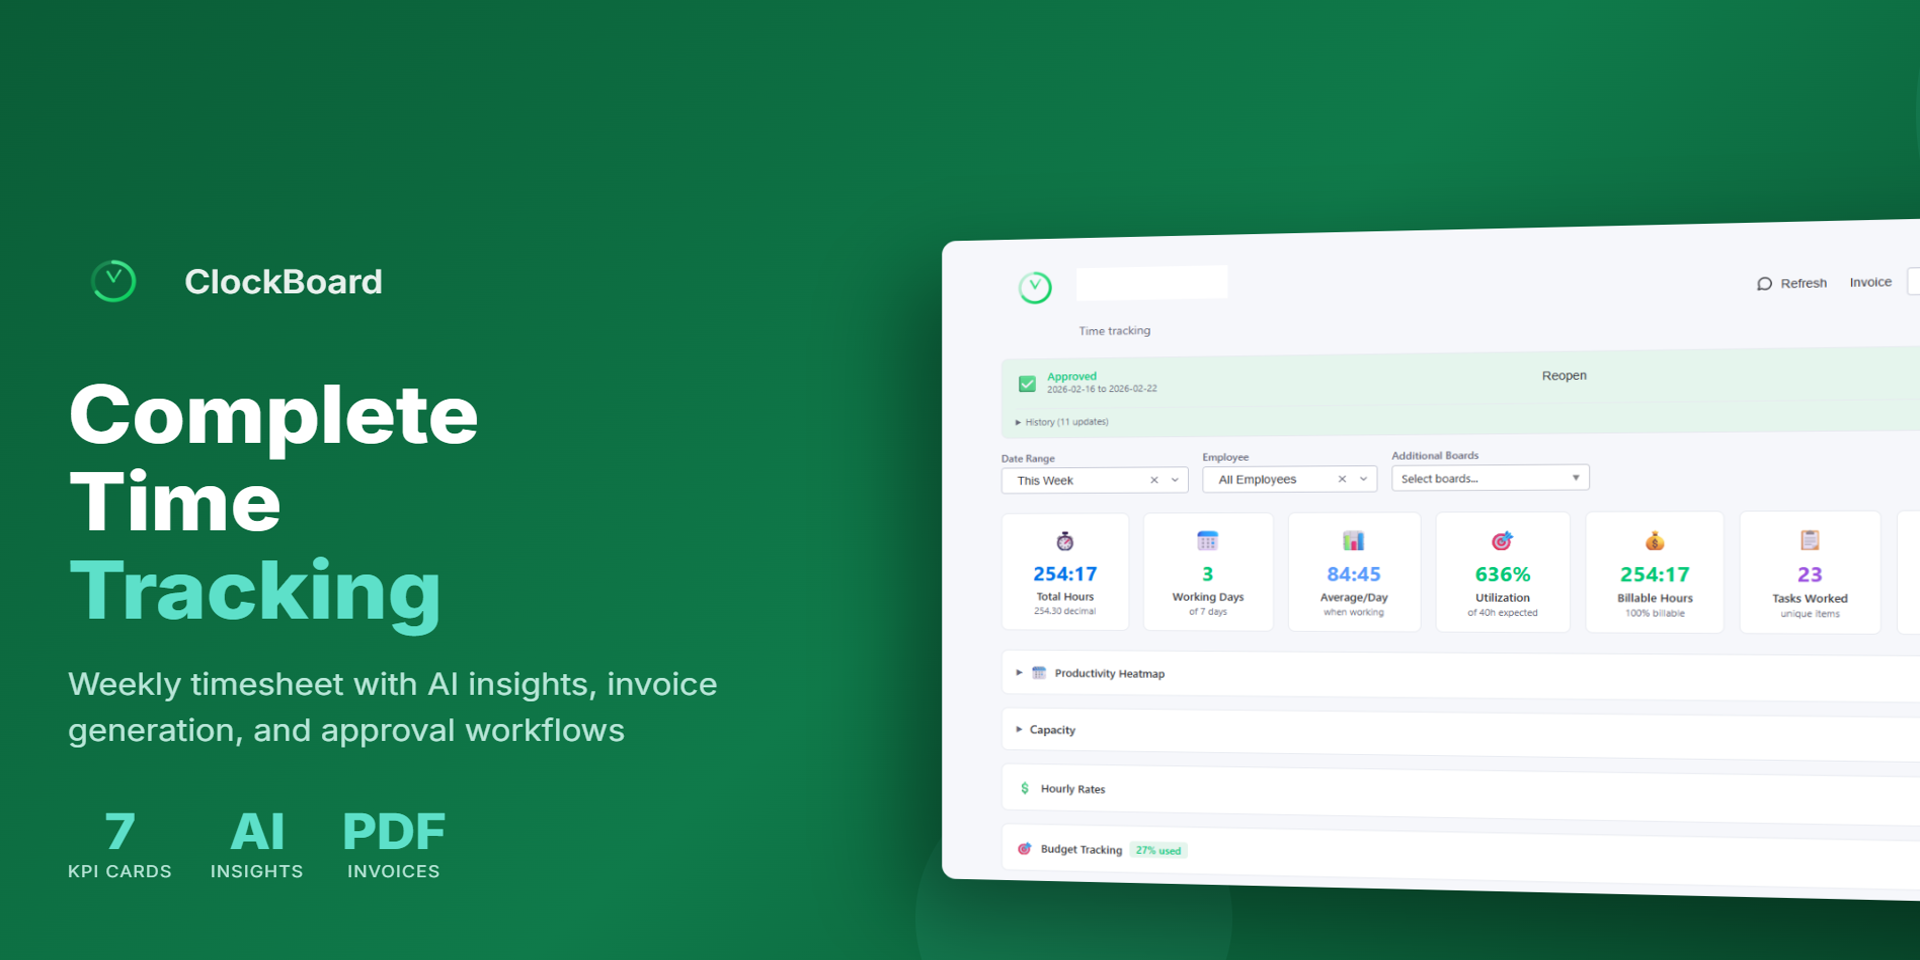
Professional timesheets with KPIs, invoices, and AI insights
ClockBoard is a complete time tracking solution built natively for monday.com. Designed for teams, managers, and freelancers who need to track hours, generate invoices, and manage approvals — all without leaving monday.
What you get with ClockBoard:
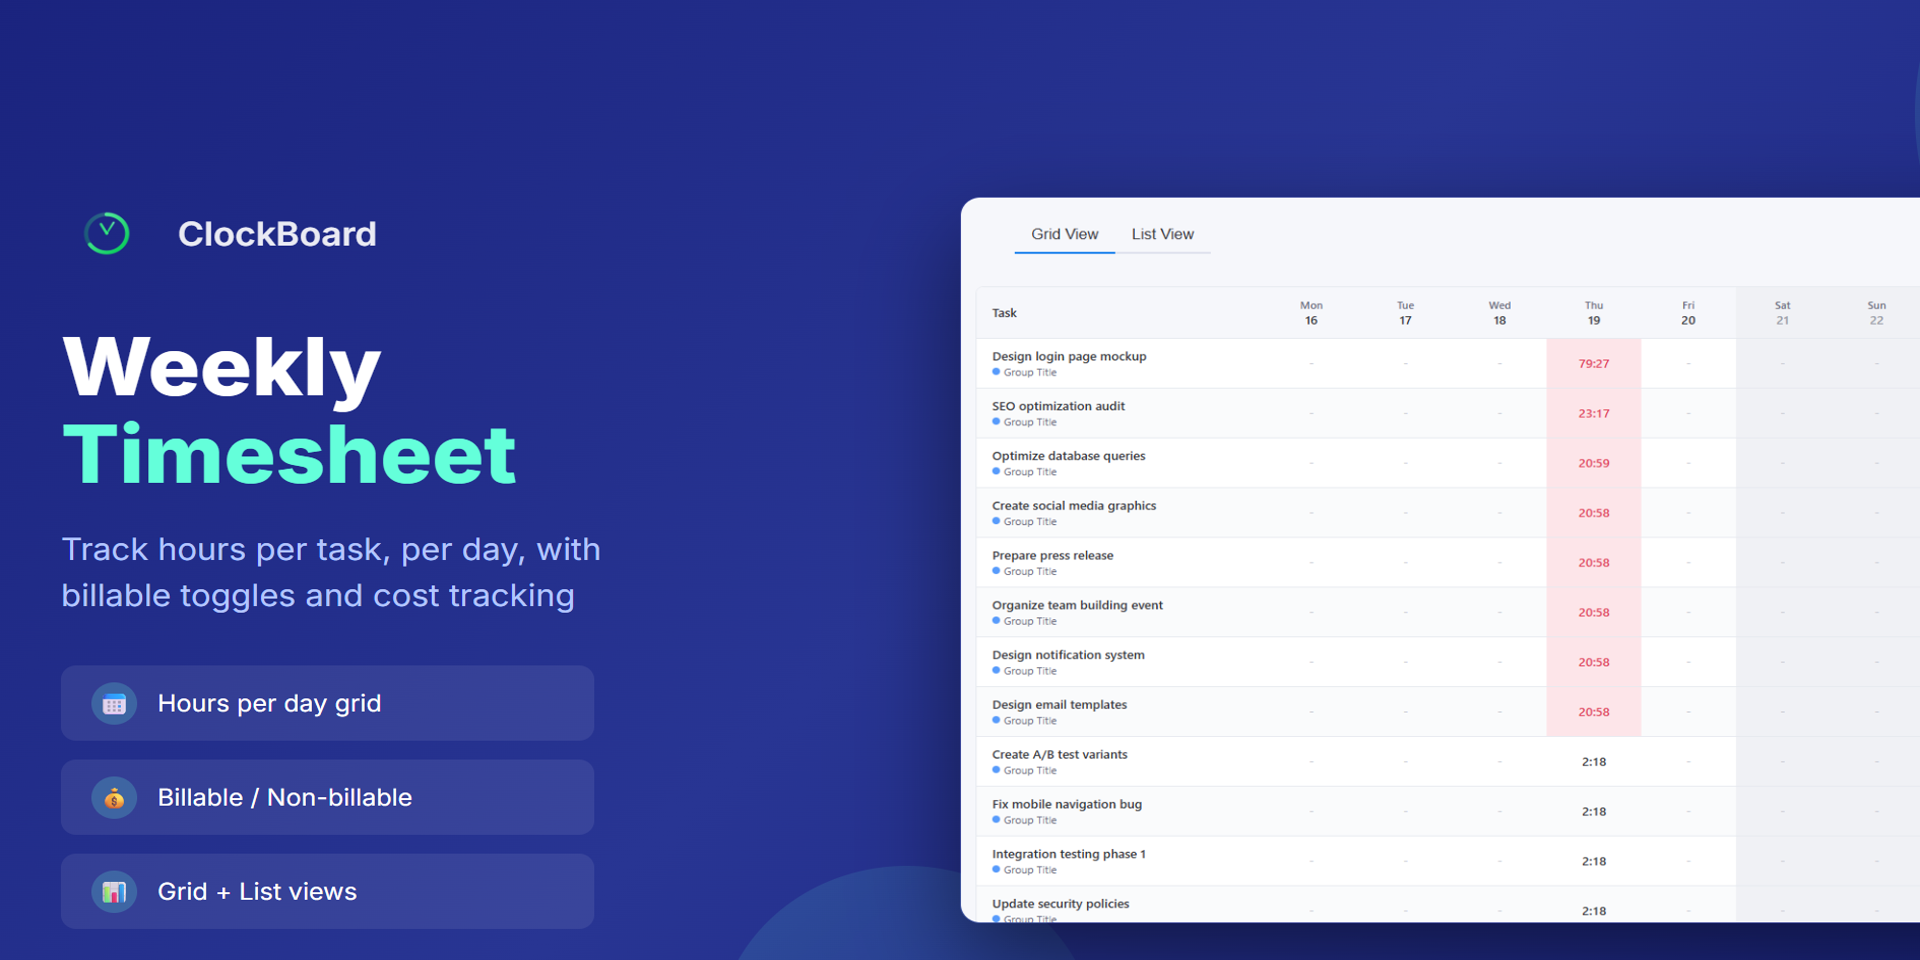
Weekly Timesheet Grid — Log hours per task, per day, with billable/non-billable toggles and cost tracking. Switch between Grid and List views
7 KPI Dashboard Cards — Total hours, working days, daily average, utilization rate, billable hours, tasks worked, and overtime — all at a glance
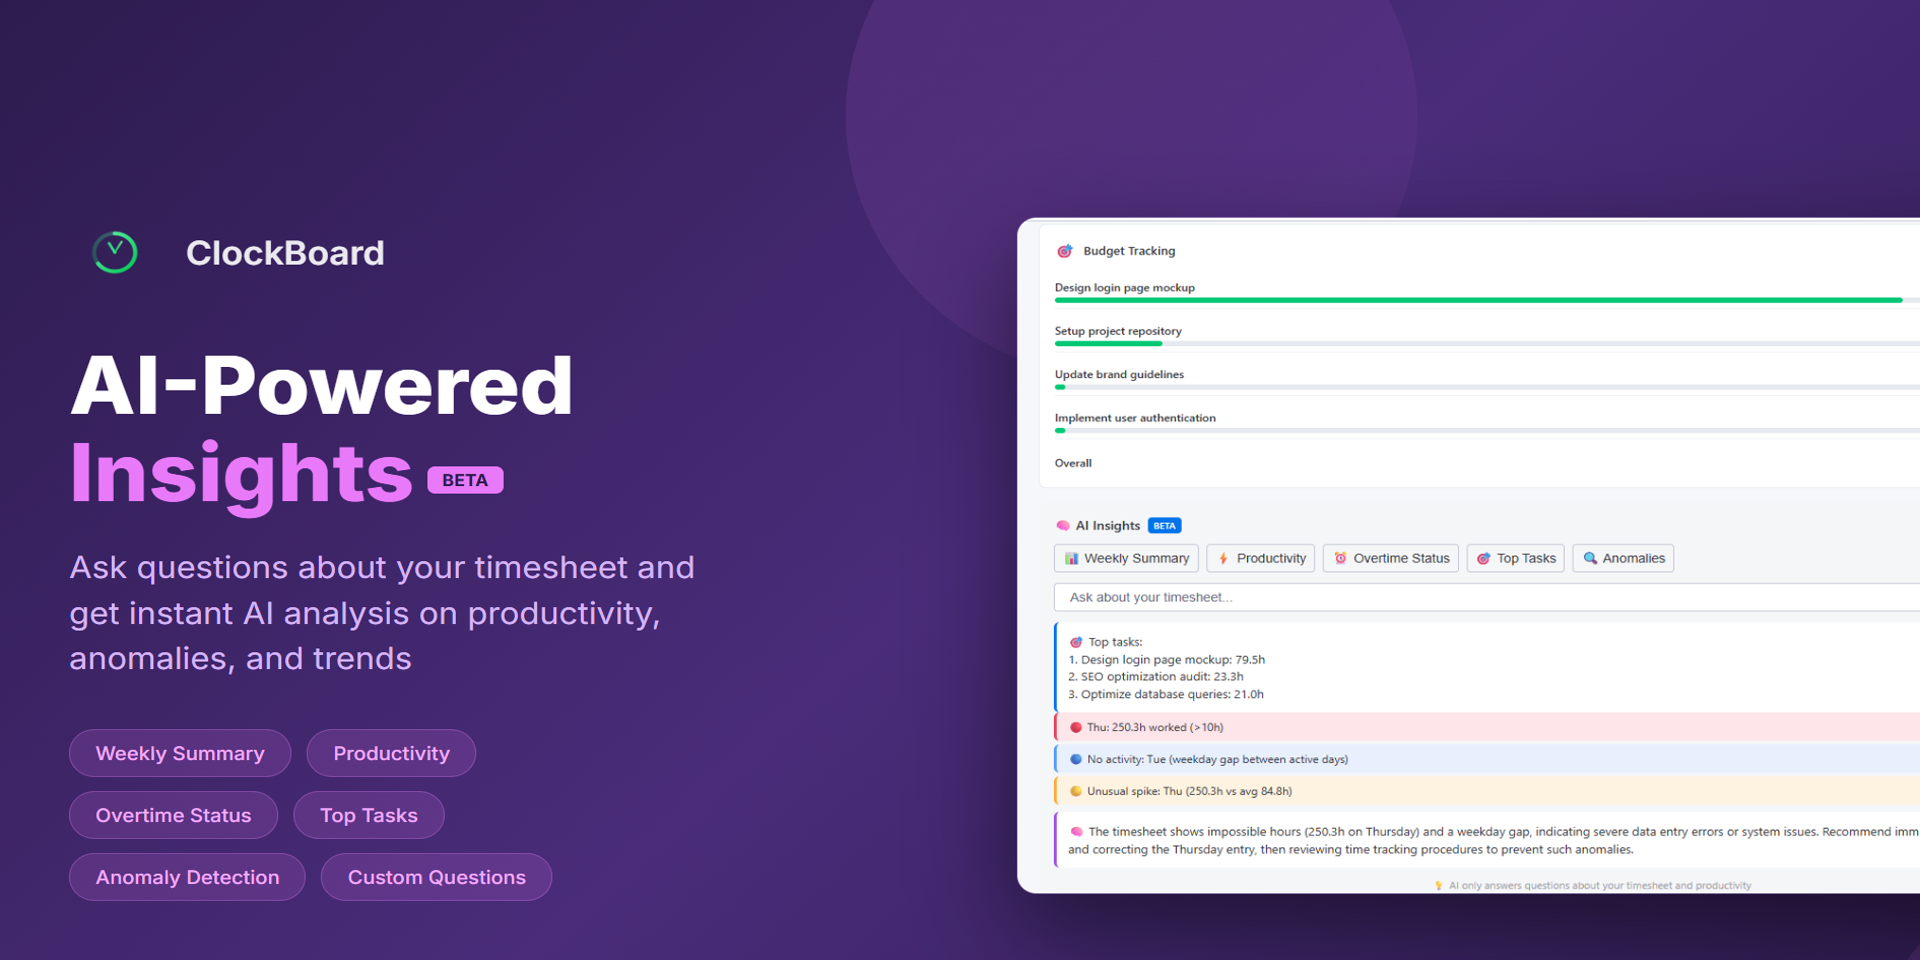
AI-Powered Insights (Beta) — Ask questions about your timesheet and get instant analysis on productivity, anomalies, and trends. Powered by DeepSeek AI
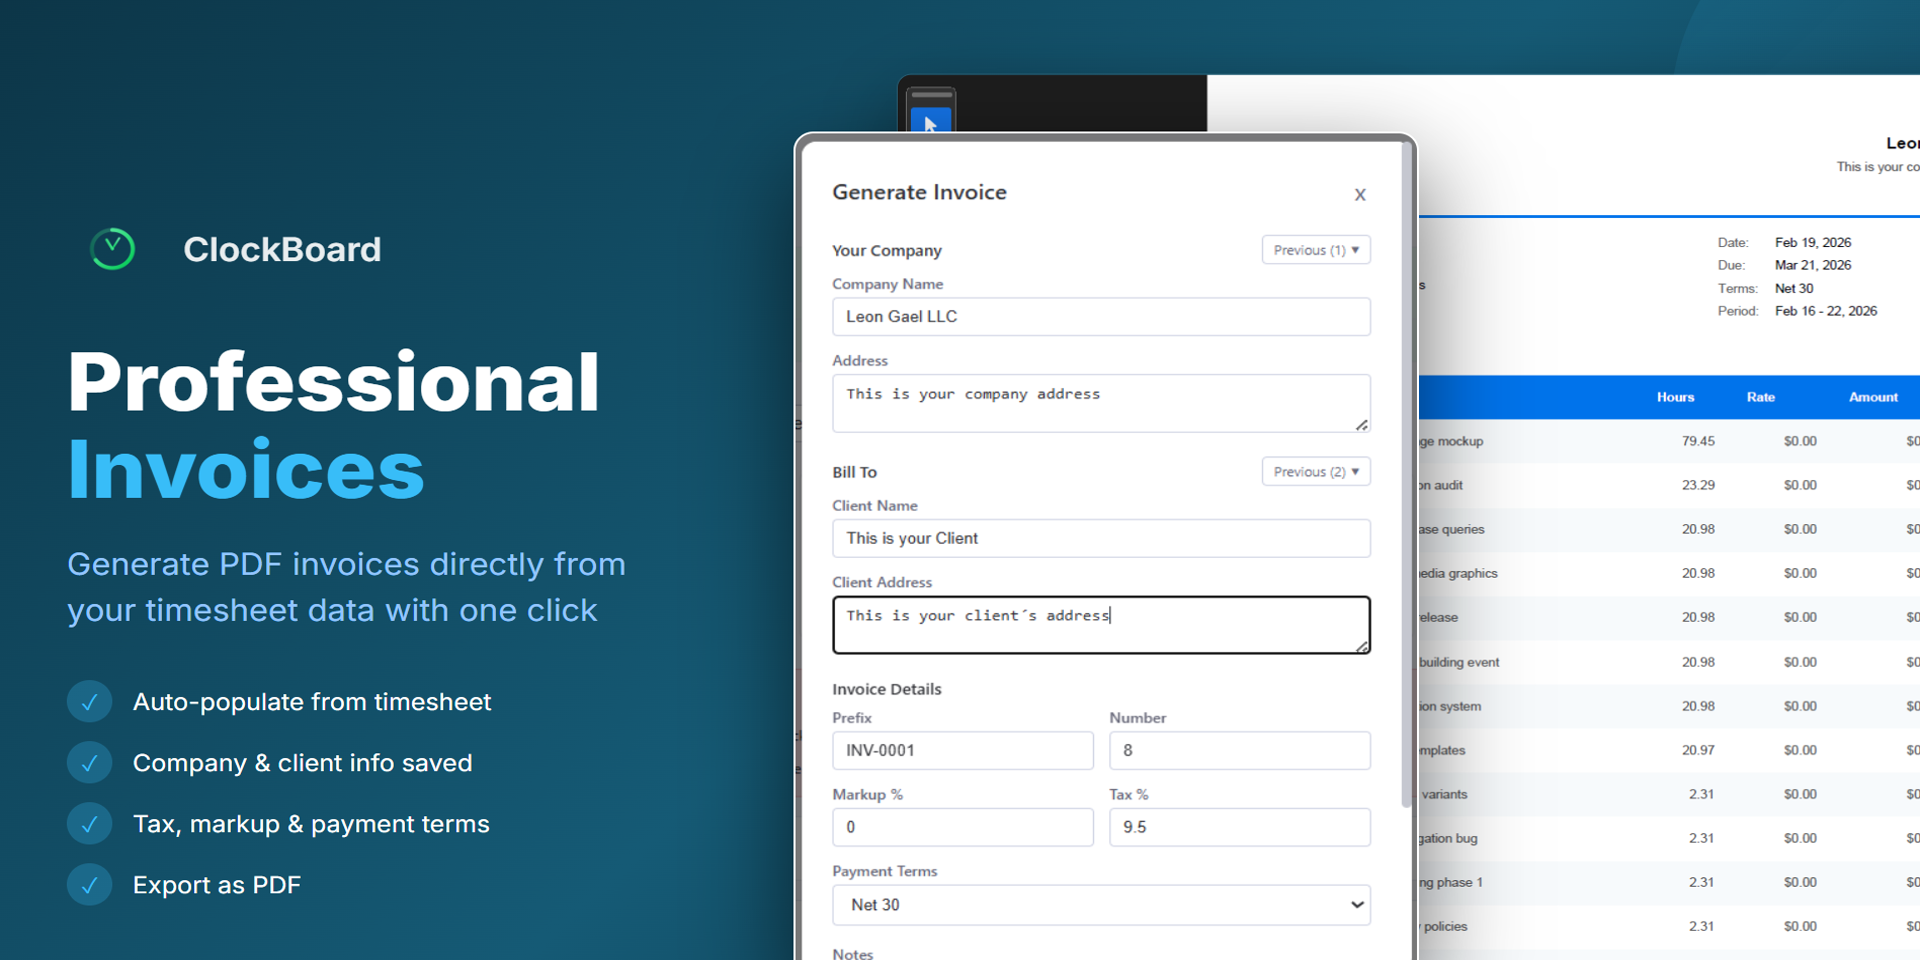
Professional PDF Invoices — Generate invoices directly from your timesheet data. Auto-populate line items, add tax, markup, and payment terms
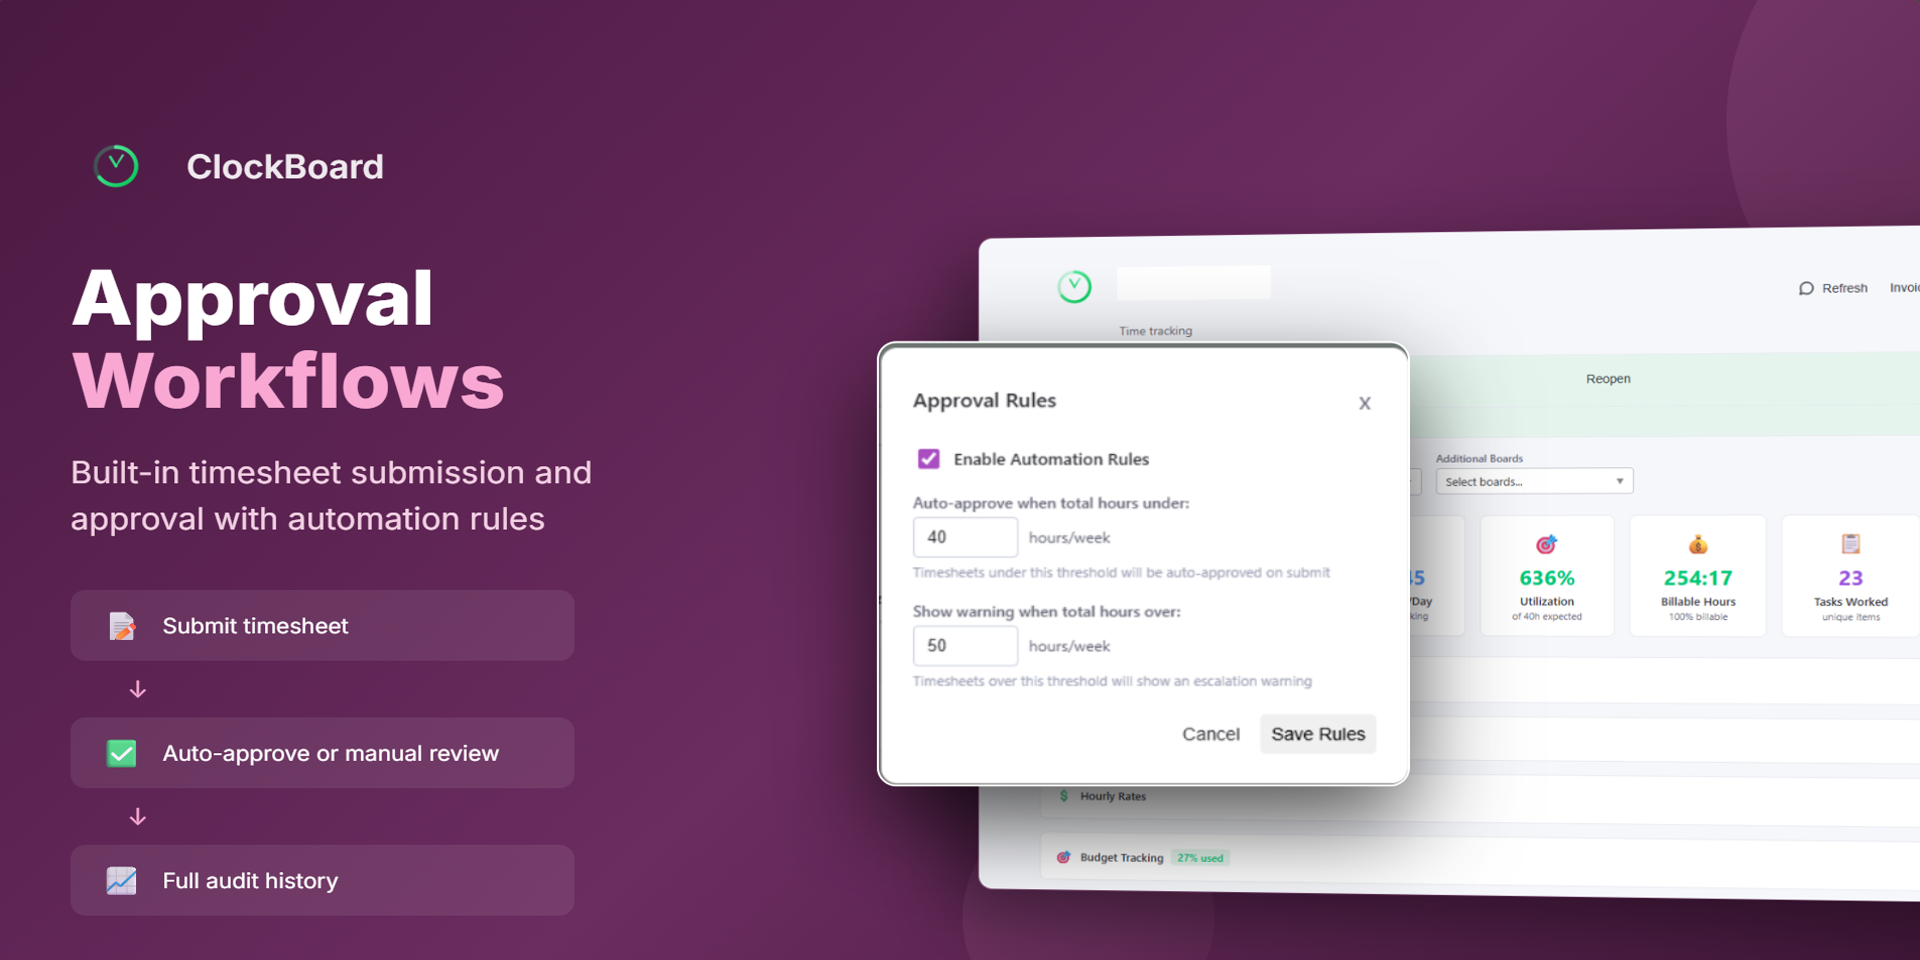
Approval Workflows — Submit timesheets for review with automation rules for auto-approval. Full audit history included
Export & Reports — Download formatted reports in Excel, CSV, or PDF
Productivity Heatmap — Visualize work patterns across the week
Budget Tracking — Compare actual hours vs. estimates with hourly rates per user
Who is ClockBoard for?
Project managers tracking team hours and budgets
Freelancers and consultants generating client invoices
HR and operations teams managing timesheet approvals
Any team that needs time visibility inside monday.com
About Leon Gael LLC
We build productivity tools for monday.com that help teams work smarter. Visit us at leongael.xyz
Security & Compliance
The app developer did not provide the security and compliance information for this app.
Reviews
No reviews yet.
Historical data
Installation history
We have data for December 28, 2024 onwards only. Collected sometime after 00:00 UTC daily.
Total number of installs
Change in total number of installs in last 1 day(s)
Compares the number of installs on each date with 1 days previously:
Max
Min
Current
Change in total number of installs in last 7 day(s)
Compares the number of installs on each date with 7 days previously:
Max
Min
Current
Change in total number of installs in last 30 day(s)
Compares the number of installs on each date with 30 days previously:
Max
Min
Current
Change in total number of installs in last 90 day(s)
Compares the number of installs on each date with 90 days previously:
Max
Min
Current
Change in total number of installs in last 180 day(s)
Compares the number of installs on each date with 180 days previously:
Max
Min
Current
Ratings history
Categories history
Each of the following is a yes/no answer, so the graphs show 1 for yes, and 0 for no.