See bottlenecks, trends, and priorities with flow metrics.
Flow Metrics by Flusss brings professional flow analytics to your monday.com boards and it’s surprisingly easy to set up. You only need to define your workflow and choose a date range to start seeing how work is really flowing, using data you already have.
It’s ideal for teams and leaders who need trustworthy visibility into delivery flow, such as Product & Engineering, Operations, Customer Support, and any group managing continuous delivery across changing priorities.
Key Charts & Insights
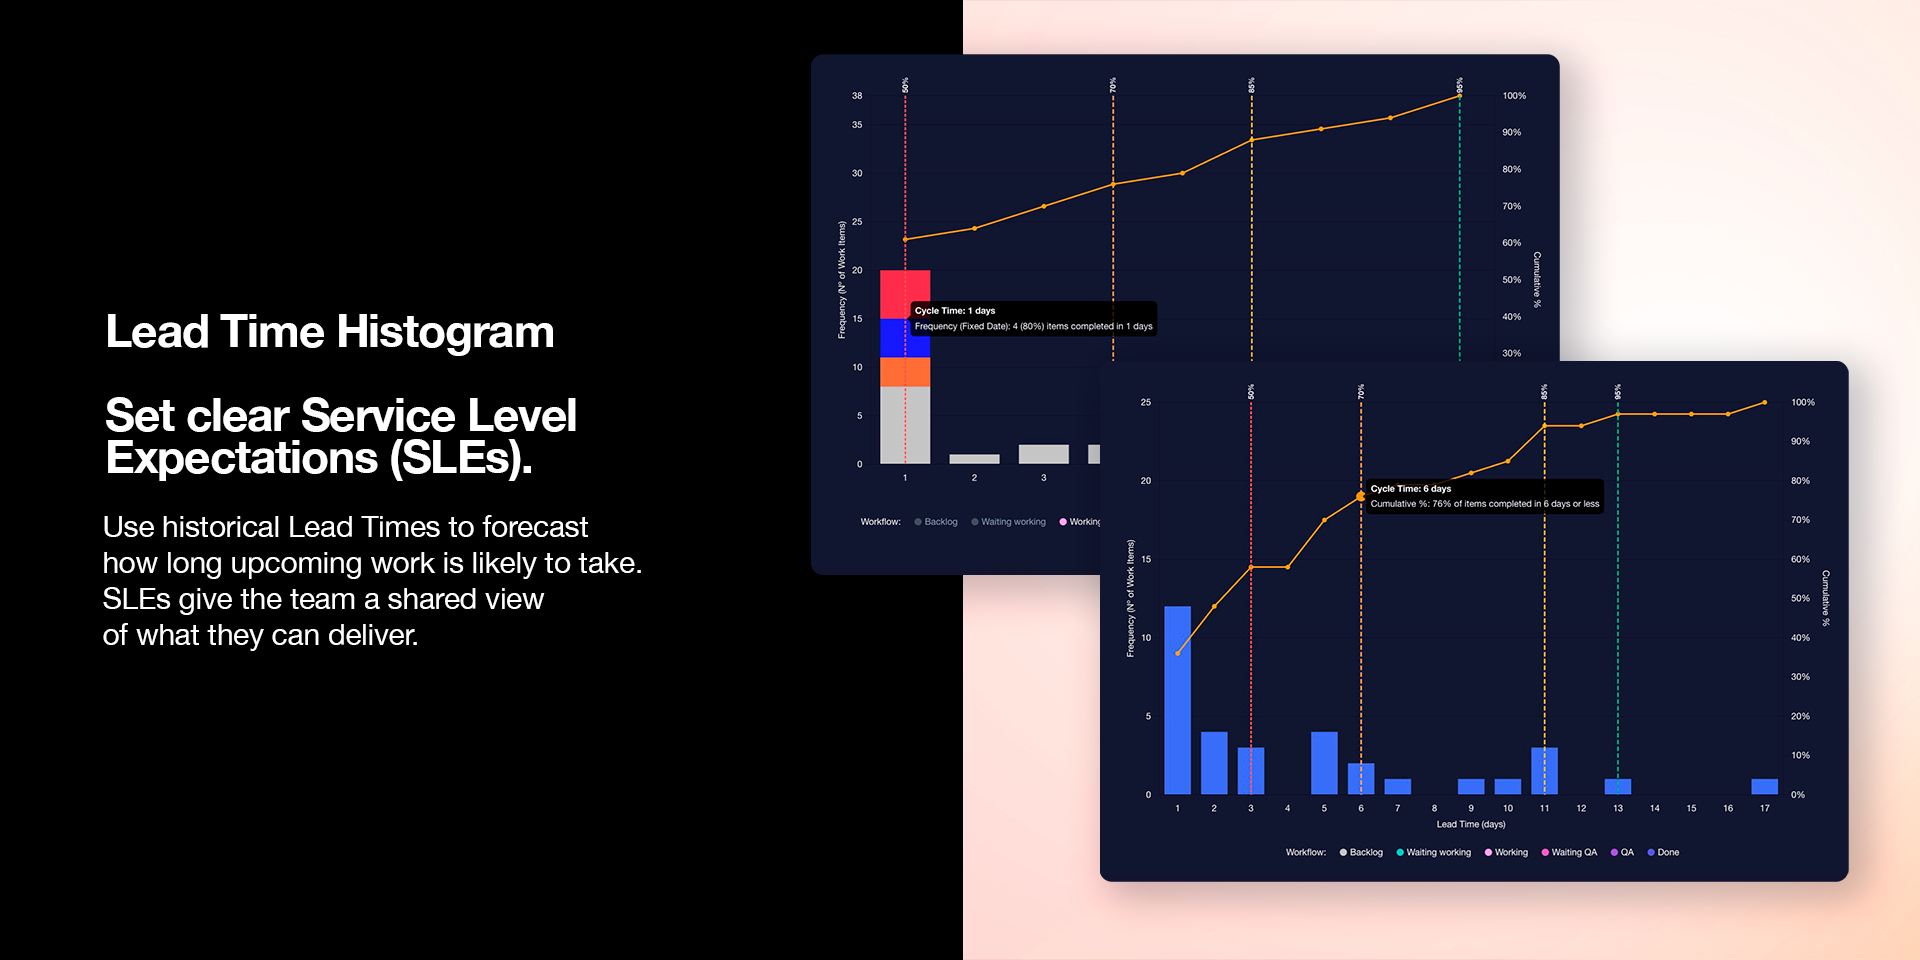
Lead Time Histogram
Set clear Service Level Expectations (SLEs) using percentiles and the cumulative curve to understand and forecast how long upcoming work is likely to take.
For deeper comparisons, switch to a stacked bar view based on another Status column to see how lead time distribution changes across categories.
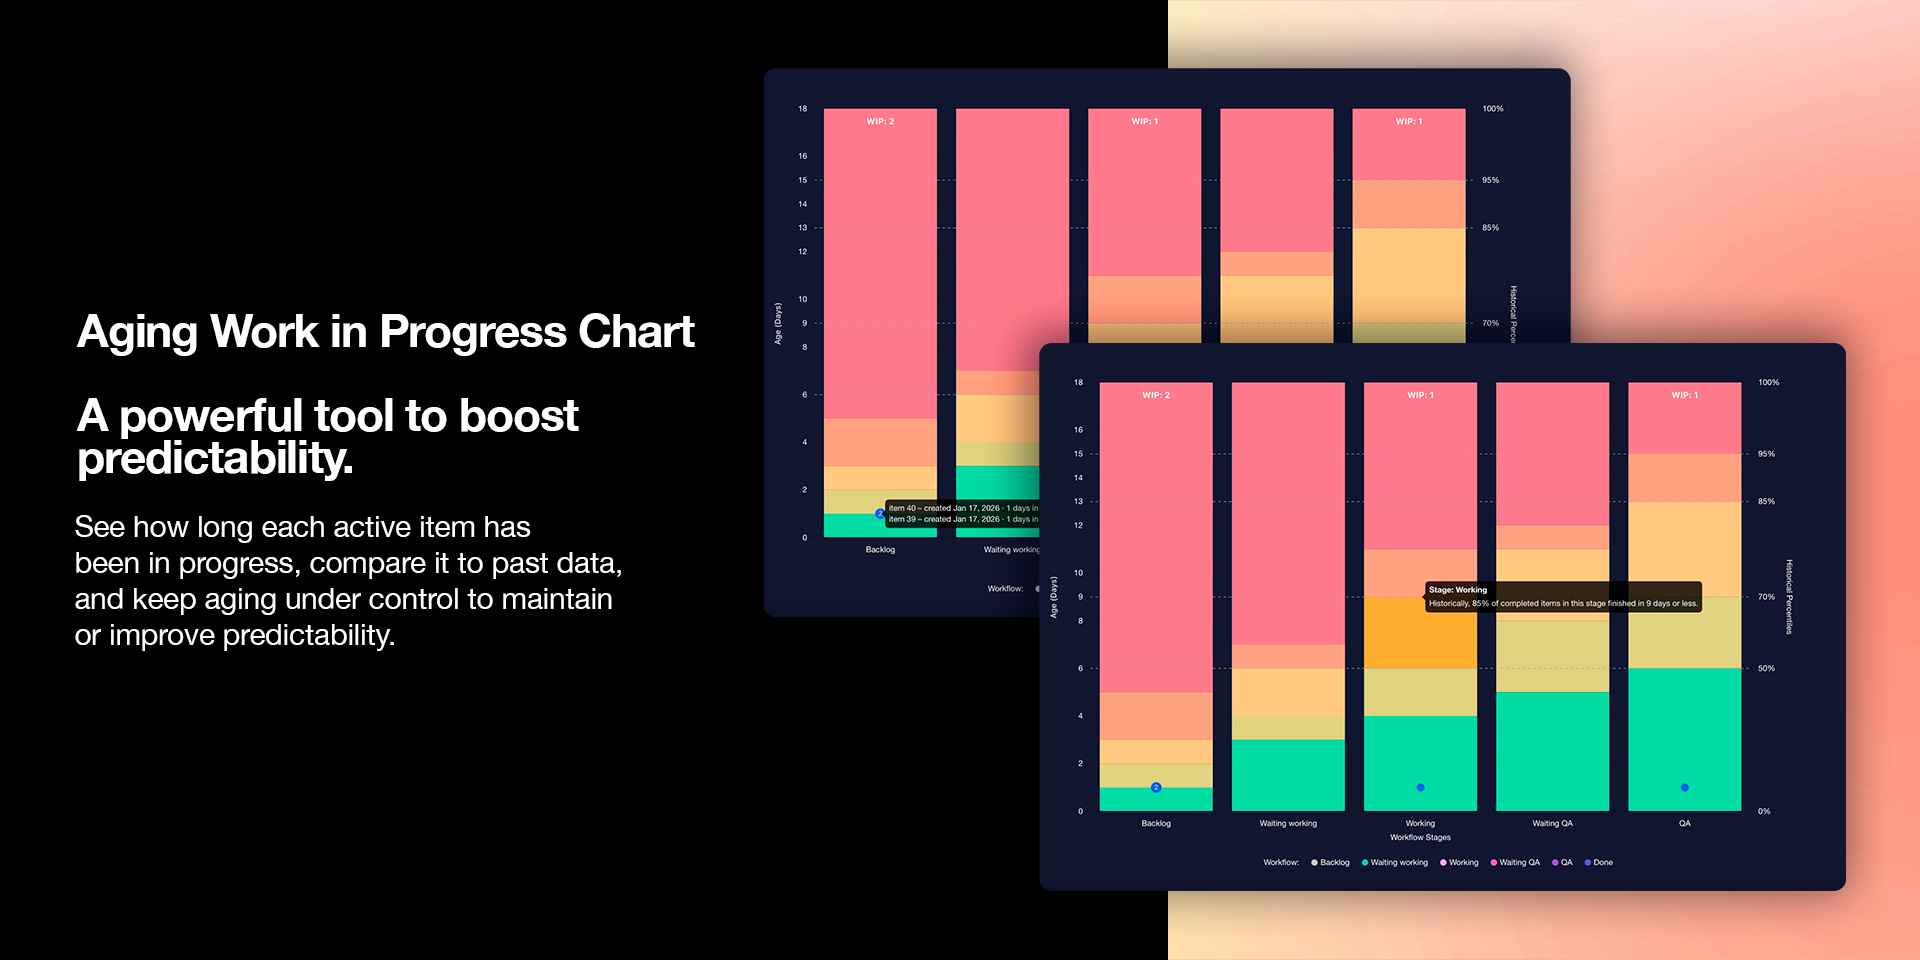
Aging Work in Progress (WIP)
See how long each item has been in progress and compare it to past performance so aging stays under control.This makes risk visible earlier and helps teams focus on finishing before work gets stuck.
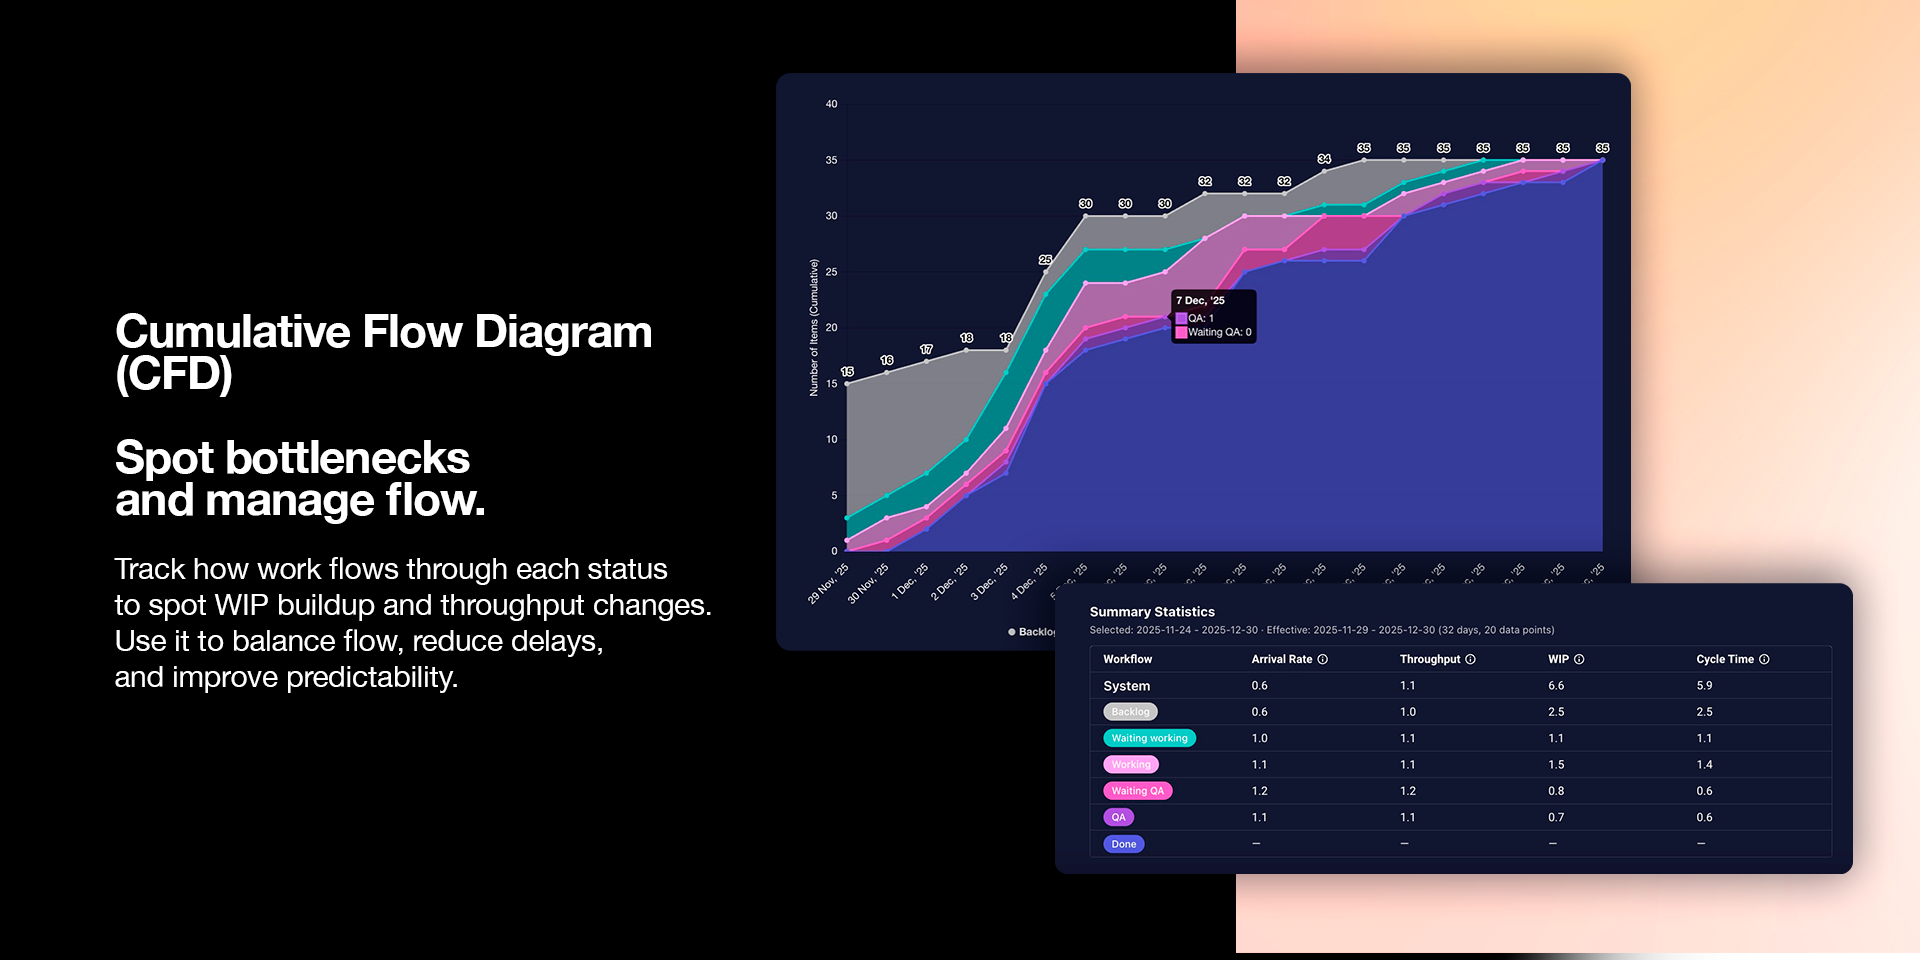
Cumulative Flow Diagram (CFD)
Track how work moves through each status to spot WIP variations or throughput shifts. Use the summary with metrics like arrival rate, throughput, and WIP for deeper analysis.
{
"id": 10001103,
"marketplace_developer_id": 100000173,
"app_id": 10252756,
"app_type": "app",
"security_info": {},
"gallery_assets": [
{
"url": "https://cdn.monday.com/marketplace/10001103/10001103_2026_2_5_14_30_55_z20u1ps.mp4",
"type": "video"
},
{
"url": "https://cdn.monday.com/marketplace/10001103/10001103_2026_2_5_14_31_7_6chv0eo.png",
"type": "image"
},
{
"url": "https://cdn.monday.com/marketplace/10001103/10001103_2026_2_5_14_31_12_wdt3v1.png",
"type": "image"
},
{
"url": "https://cdn.monday.com/marketplace/10001103/10001103_2026_2_5_14_31_16_0tinxf.png",
"type": "image"
}
],
"description": "<p><strong>Flow Metrics by </strong><a href=\"https://www.flusss.net/\" rel=\"noopener noreferrer\" target=\"_blank\"><strong>Flusss</strong></a> brings professional flow analytics to your <a href=\"http://monday.com/\" rel=\"noopener noreferrer\" target=\"_blank\">monday.com</a> boards and it’s <em>surprisingly easy</em> to set up. You only need to <strong>define your workflow</strong> and <strong>choose a date range</strong> to start seeing how work is really flowing, using data you already have.</p><p>It’s ideal for teams and leaders who need trustworthy visibility into delivery flow, such as <strong>Product & Engineering</strong>, <strong>Operations</strong>, <strong>Customer Support</strong>, and any group managing continuous delivery across changing priorities.</p><p><strong>Key Charts & Insights</strong></p><p><strong>Lead Time Histogram</strong></p><p>Set clear <strong>Service Level Expectations (SLEs)</strong> using <strong>percentiles</strong> and the <strong>cumulative curve</strong> to understand and forecast how long upcoming work is likely to take.</p><p>For deeper comparisons, switch to a <strong>stacked bar view</strong> based on another <strong>Status</strong> column to see how lead time distribution changes across categories.</p><p><strong>Aging Work in Progress (WIP)</strong></p><p>See how long each item has been in progress and compare it to past performance so aging stays under control.This makes risk visible earlier and helps teams focus on finishing before work gets stuck.</p><p><strong>Cumulative Flow Diagram (CFD)</strong></p><p>Track how work moves through each status to spot <strong>WIP variations</strong> or <strong>throughput shifts</strong>. Use the summary with metrics like <strong>arrival rate</strong>, <strong>throughput</strong>, and <strong>WIP</strong> for deeper analysis.</p><p><strong>Support & Demo</strong></p><p>Need help or a demo? check our<a href=\"https://www.flusss.net/resources/flow-metrics-app/getting-started\" rel=\"noopener noreferrer\" target=\"_blank\"> resource page</a> or book a demo here: <a href=\"https://calendly.com/kevin-flusss/free-ks-app-demo-clone\" rel=\"noopener noreferrer\" target=\"_blank\">calendly</a></p><p>If you need anything else or have an idea you’d like to share, feel free to contact us anytime at <a href=\"mailto:support@flusss.net\" rel=\"noopener noreferrer\" target=\"_blank\"><strong>support@flusss.net</strong></a>.</p>",
"short_description": "See bottlenecks, trends, and priorities with flow metrics.",
"thumbnail_url": "https://cdn.monday.com/marketplace/10001103/10001103_2026_2_5_14_30_43_h4tzsdi.png",
"logo_url": "https://cdn.monday.com/marketplace/10001103/10001103_2026_2_5_14_30_40_g4omzde.png",
"feedback_url": "support@flusss.net",
"privacy_policy_url": "https://www.flusss.net/resources/data-security-and-privacy",
"featured": false,
"name": "Flow Metrics",
"how_to_use_url": "https://www.flusss.net/resources/flow-metrics-app/how-to-use/cumulative-flow-diagram",
"external_pricing_url": null,
"keywords": "Flow Analytics,WIP tracking,Flow metrics,Kanban Metrics,Aging WIP,Lead time,Cycle time,Cumulative flow,CFD Chart",
"compliance_answers": [],
"created_at": "2026-03-05T14:29:58.017Z",
"updated_at": "2026-03-05T14:33:07.759Z",
"automation_app_id": null,
"marketplace_category_ids": [],
"pinned_for_categories_ids": [],
"featured_for_categories_ids": [],
"pricing_data": "Free plan available",
"label": null,
"app_values": [
"Popular with CRM users"
],
"security": false,
"display_in_template_store": false,
"acquisition_source": "No touch",
"is_connector": false,
"terms_of_service_url": "https://www.flusss.net/resources/terms-of-use",
"available_for_tiers": [],
"available_for_products": [],
"google_analytics_tag_id": null,
"is_solution": false,
"app_scope_str": "boards:read,account:read",
"app_client_id": "bfe5b169be5374dbbee34d02e92a1c7d",
"app_color": {
"hsl": {
"h": 0,
"s": 0,
"l": 0,
"a": 1
},
"hex": "#000000",
"rgb": {
"r": 0,
"g": 0,
"b": 0,
"a": 1
},
"hsv": {
"h": 0,
"s": 0,
"v": 0,
"a": 1
},
"oldHue": 0,
"source": "hsv"
},
"plans": null,
"app_live_version": {
"updated_at": "2026-03-02T23:18:50.947Z",
"id": 13171491
},
"pricing_model": null,
"badges_data": {
"pricing_data": "Free plan available",
"app_values": [
"Popular with CRM users"
],
"security": false,
"acquisition_source": "No touch",
"display_in_template_store": false
},
"data": {
"is_connector": false,
"google_analytics_tag_id": null,
"is_solution": false,
"terms_of_service_url": "https://www.flusss.net/resources/terms-of-use",
"available_for_tiers": [],
"available_for_products": []
},
"display": null,
"installsDelta": {
"totalInstalls": 3
}
}