Real-time building permit tracking inside monday.com
🚨 Stop Guessing on Permits. Start Controlling Them.
PermitNerd is an AI-powered construction permit management app for teams tired of delays, surprises, and chasing permit status across disconnected city systems.
If permits slow your projects down, this app was built for you.
Most teams react to permit problems.
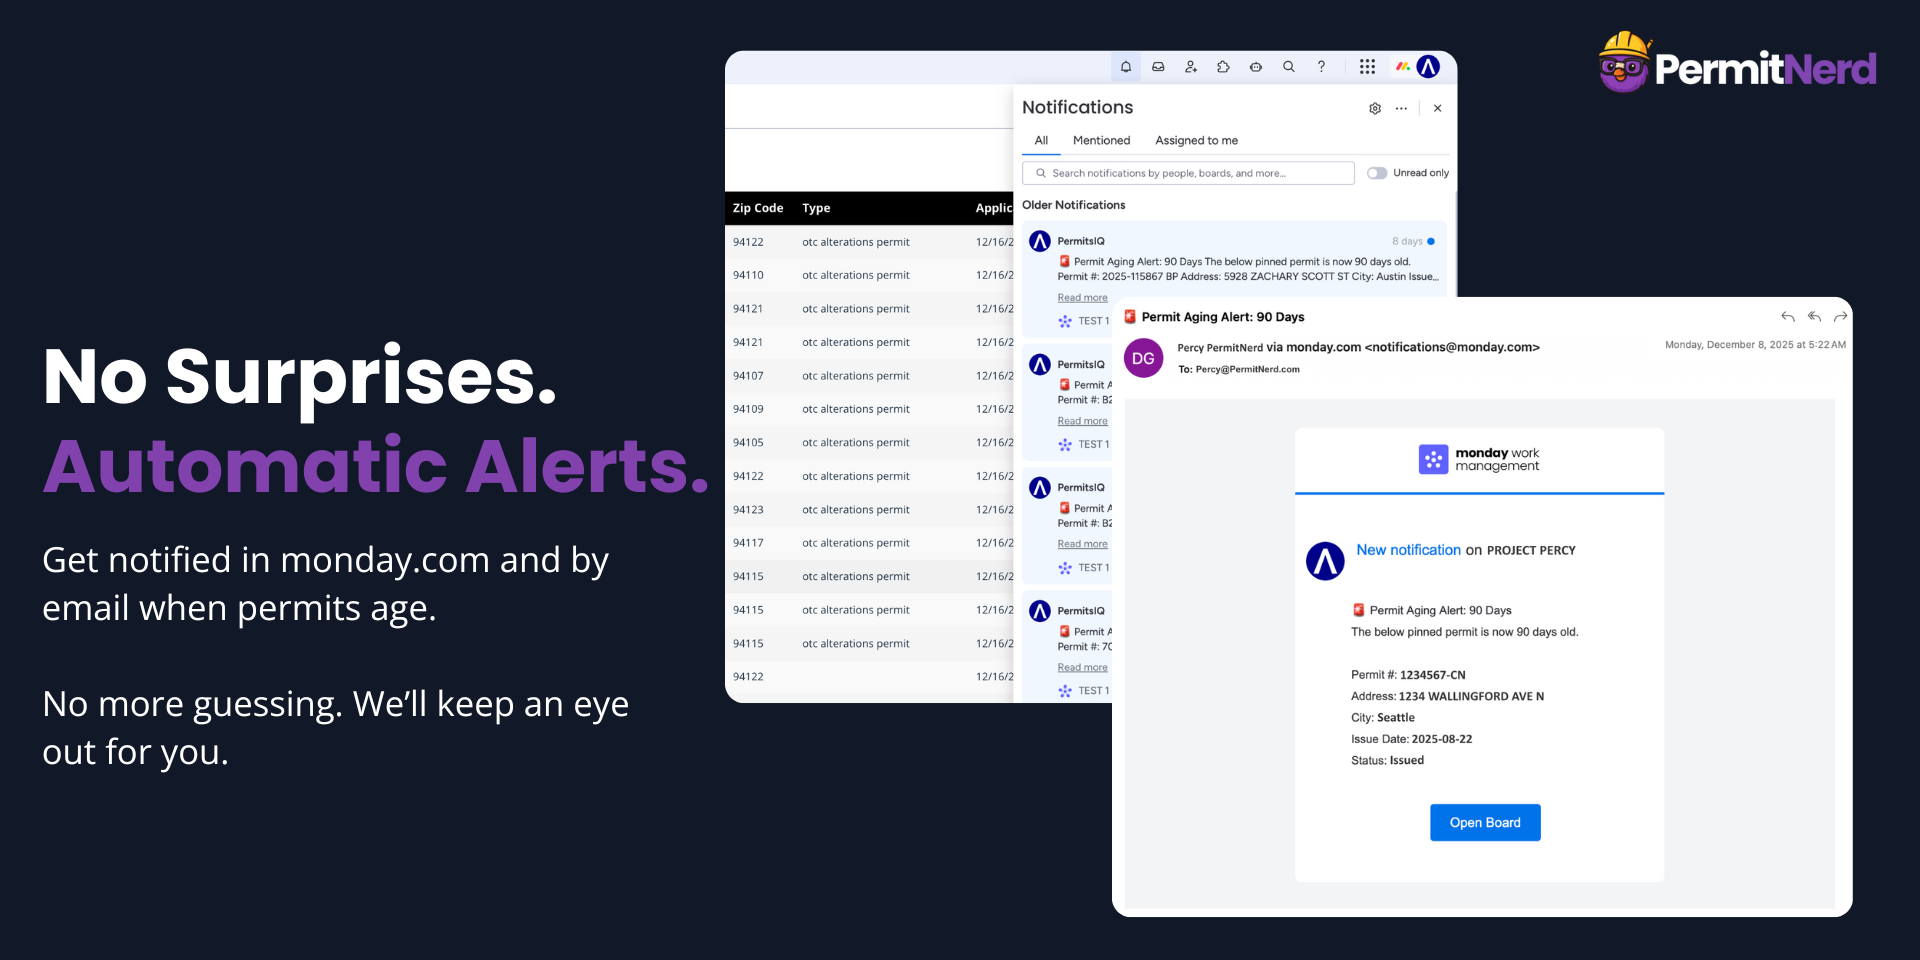
PermitNerd helps you see them coming—directly inside monday.com.
🏗️ Why PermitNerd Exists
• Approval timelines are unpredictable
• One missed permit can stall an entire project
PermitNerd turns permits into structured, searchable, and actionable intelligence—so you stay ahead instead of playing catch-up.
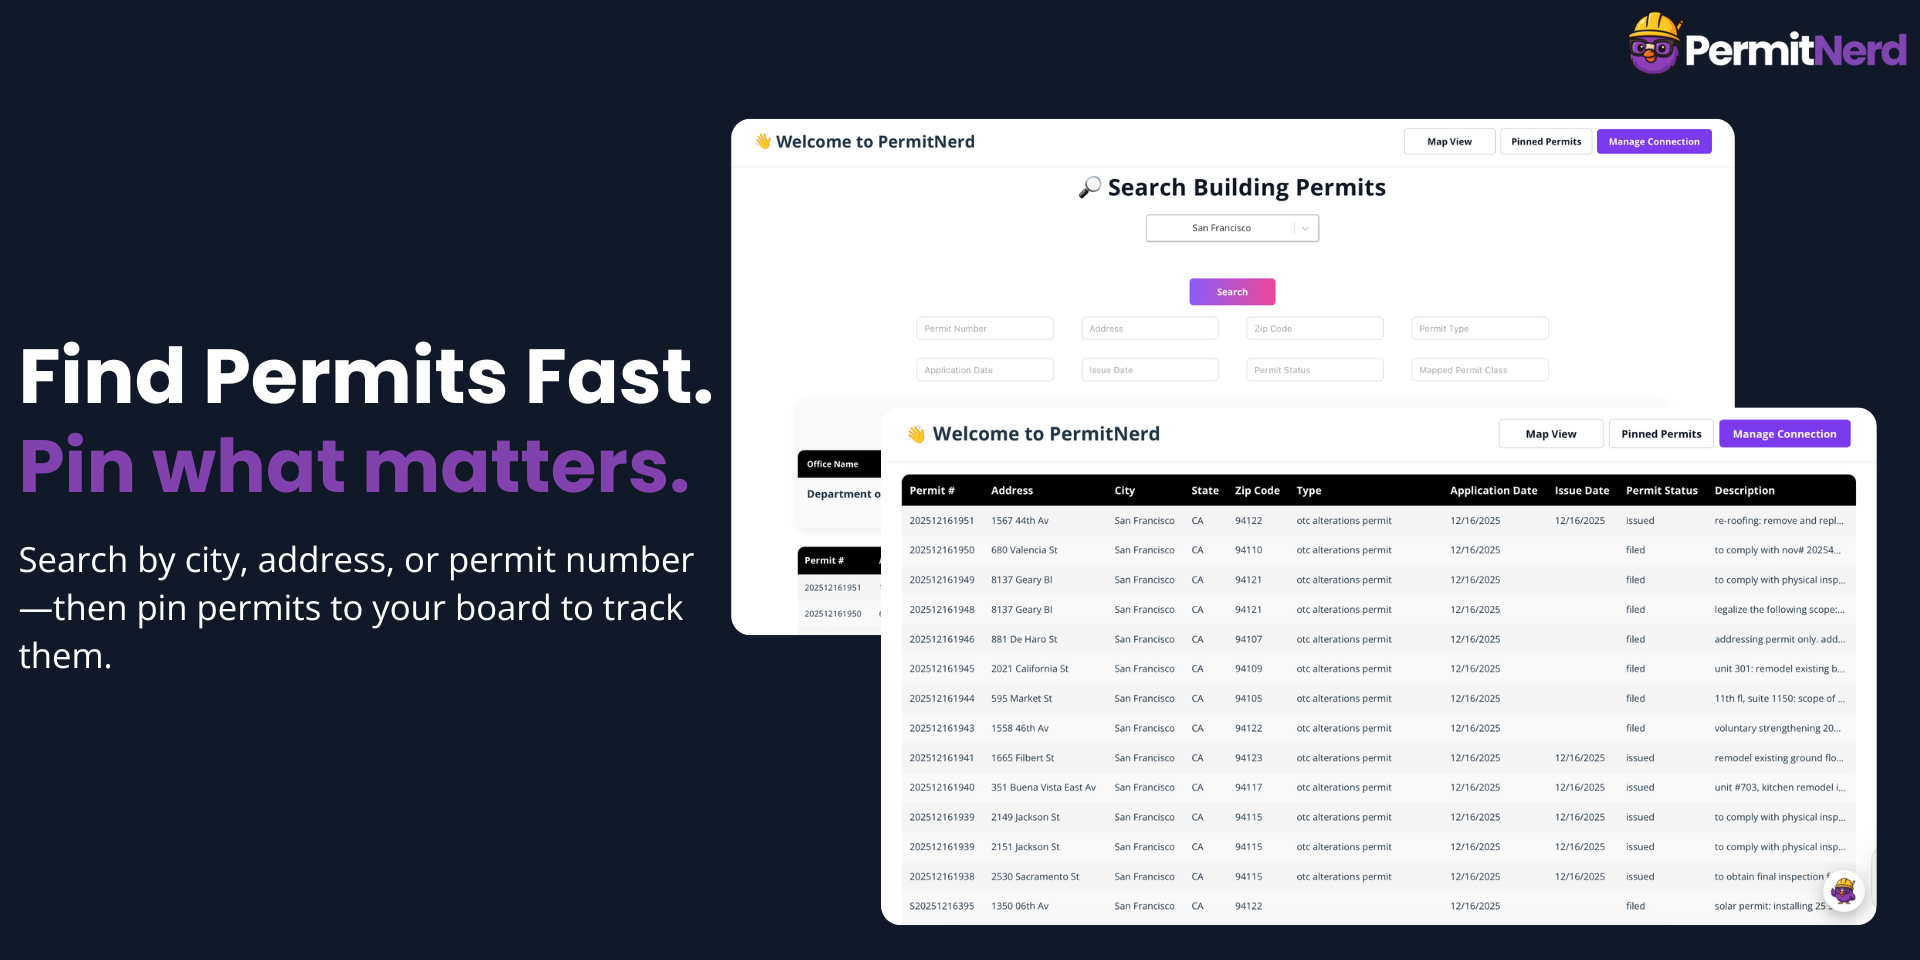
🔍 Search Real Permit Data
• Search live permit data across supported cities
• Filter by city, status, type, and key dates
📌 Pin Permits to monday Boards
• Attach permits to projects in seconds
• Keep teams aligned without spreadsheets or guesswork
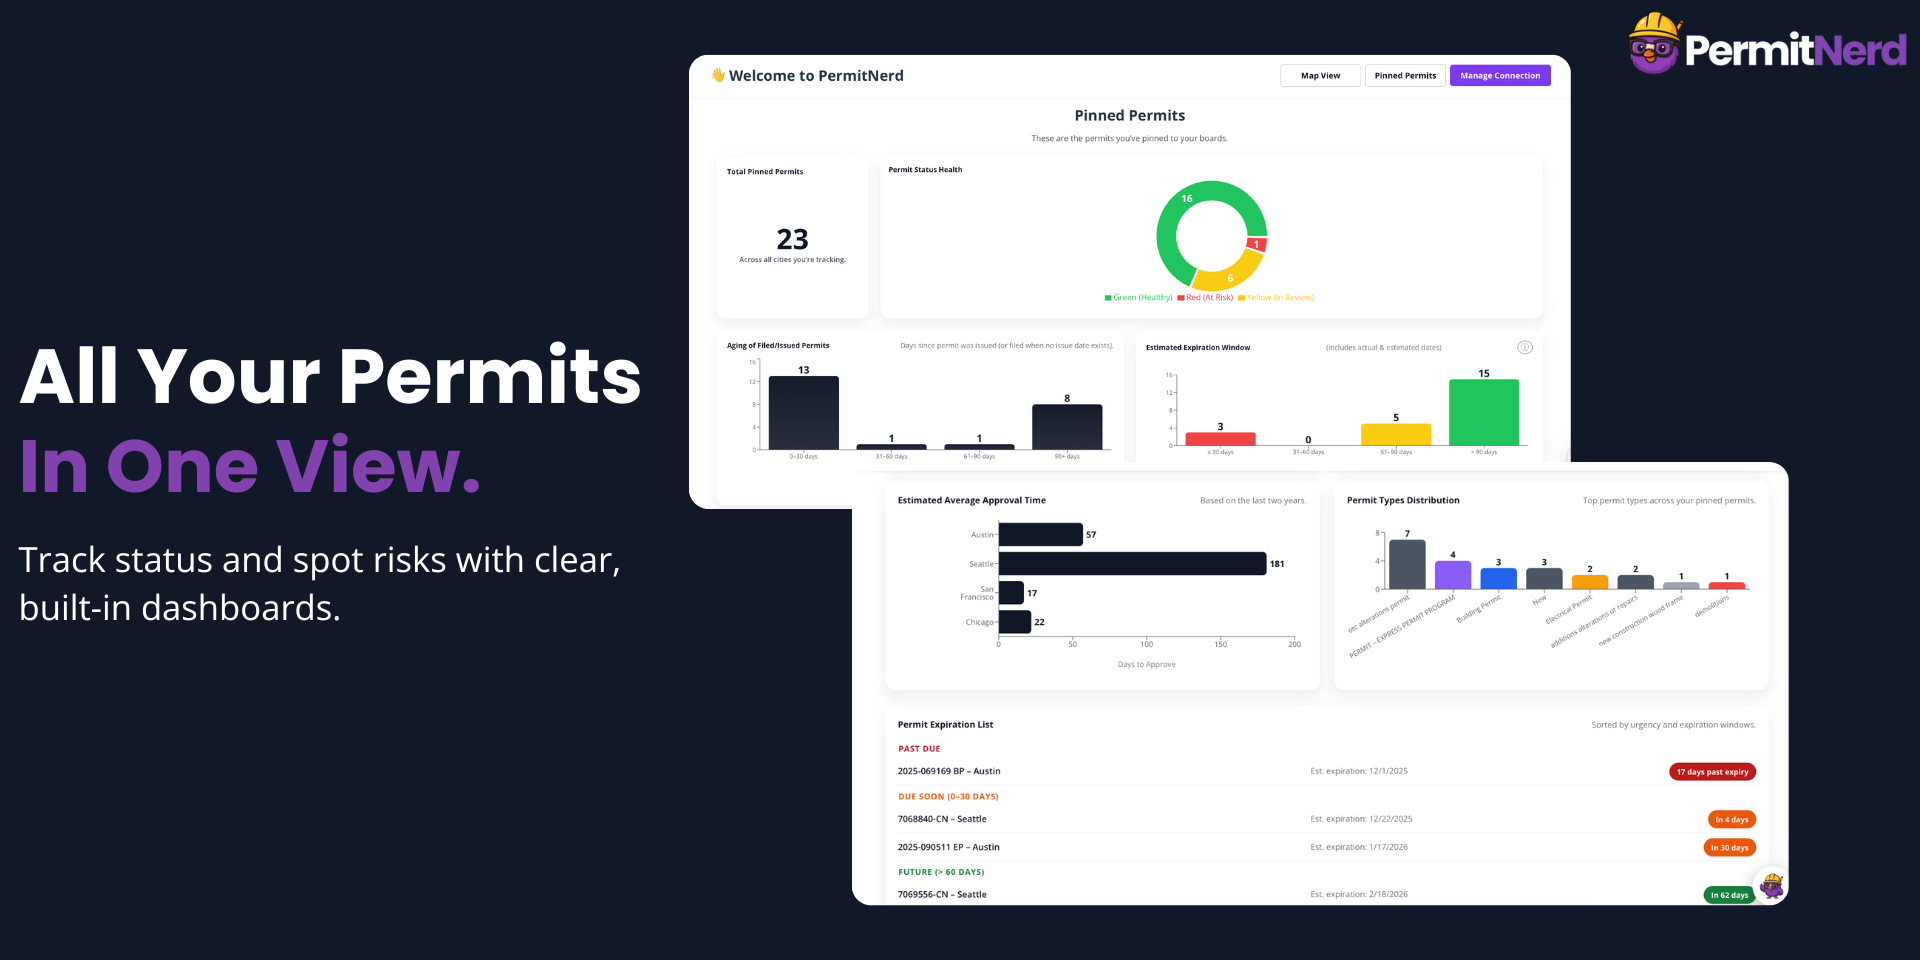
📊 Permit Intelligence Dashboards
• View average approval timelines by city
• Identify jurisdictions that slow projects down
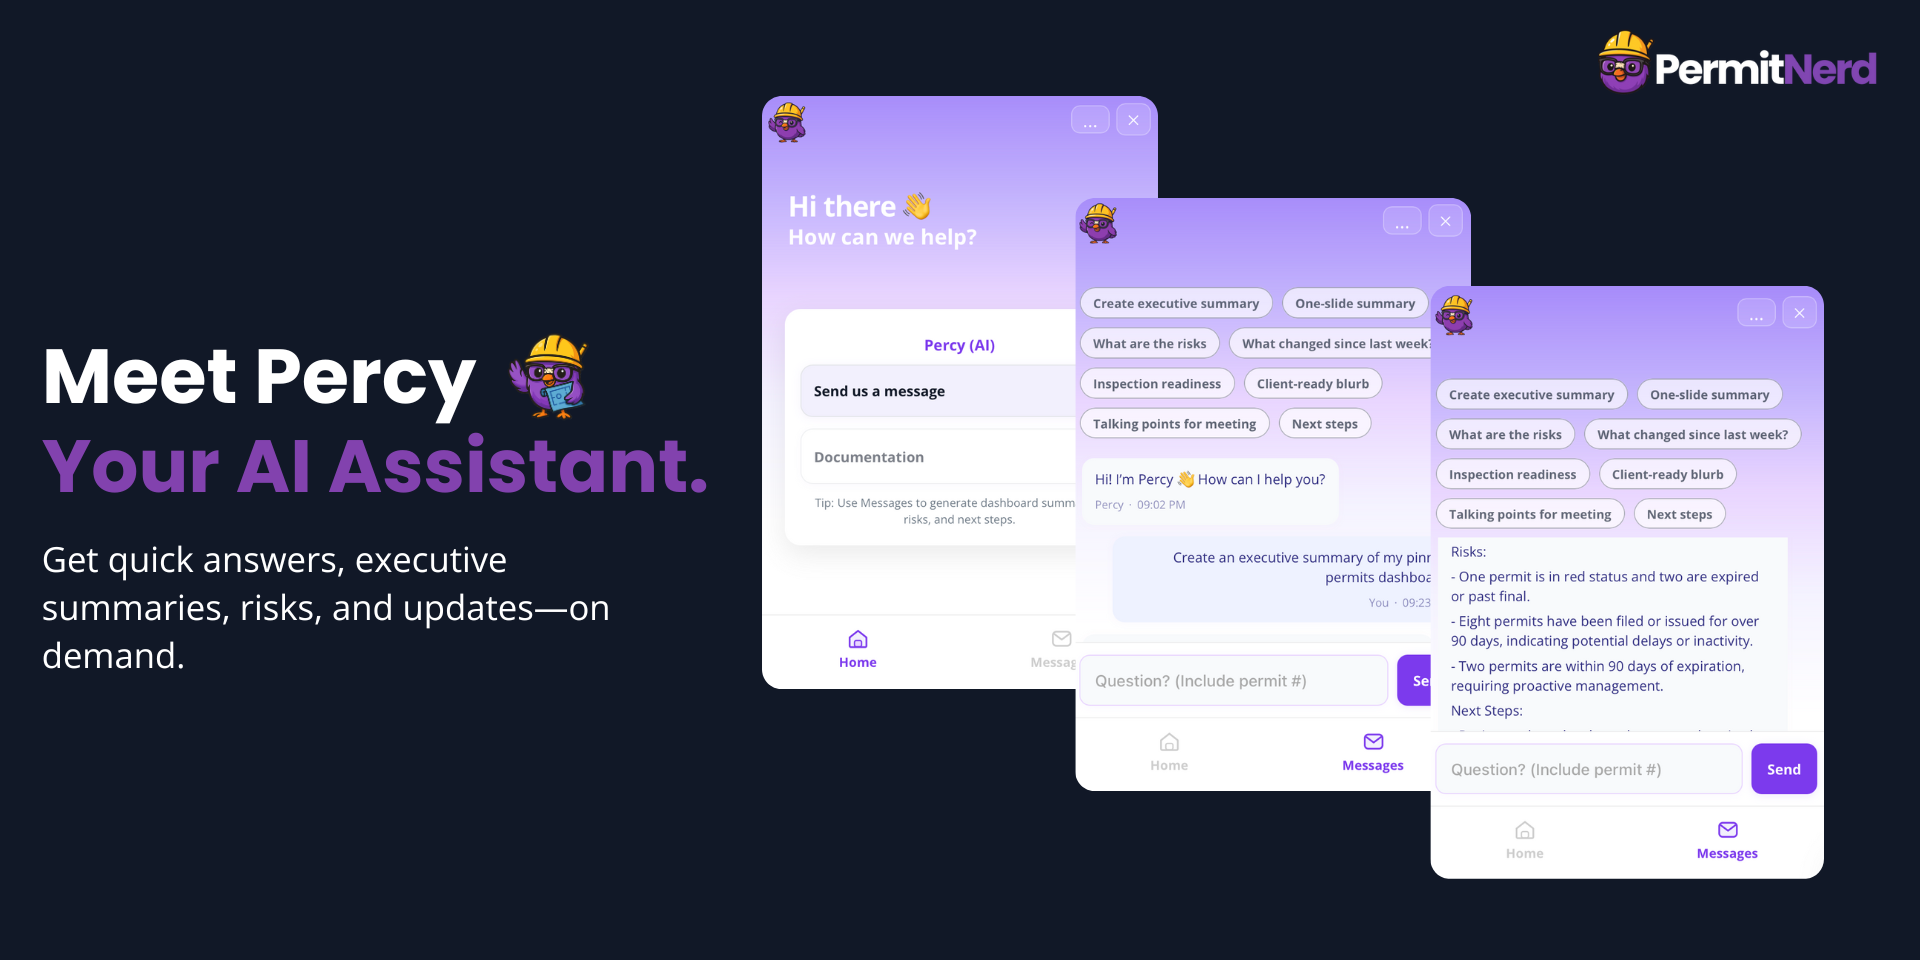
🤖 AI Permit Assistant (Percy)
• Ask why a permit is delayed or pending
• Understand what to expect next
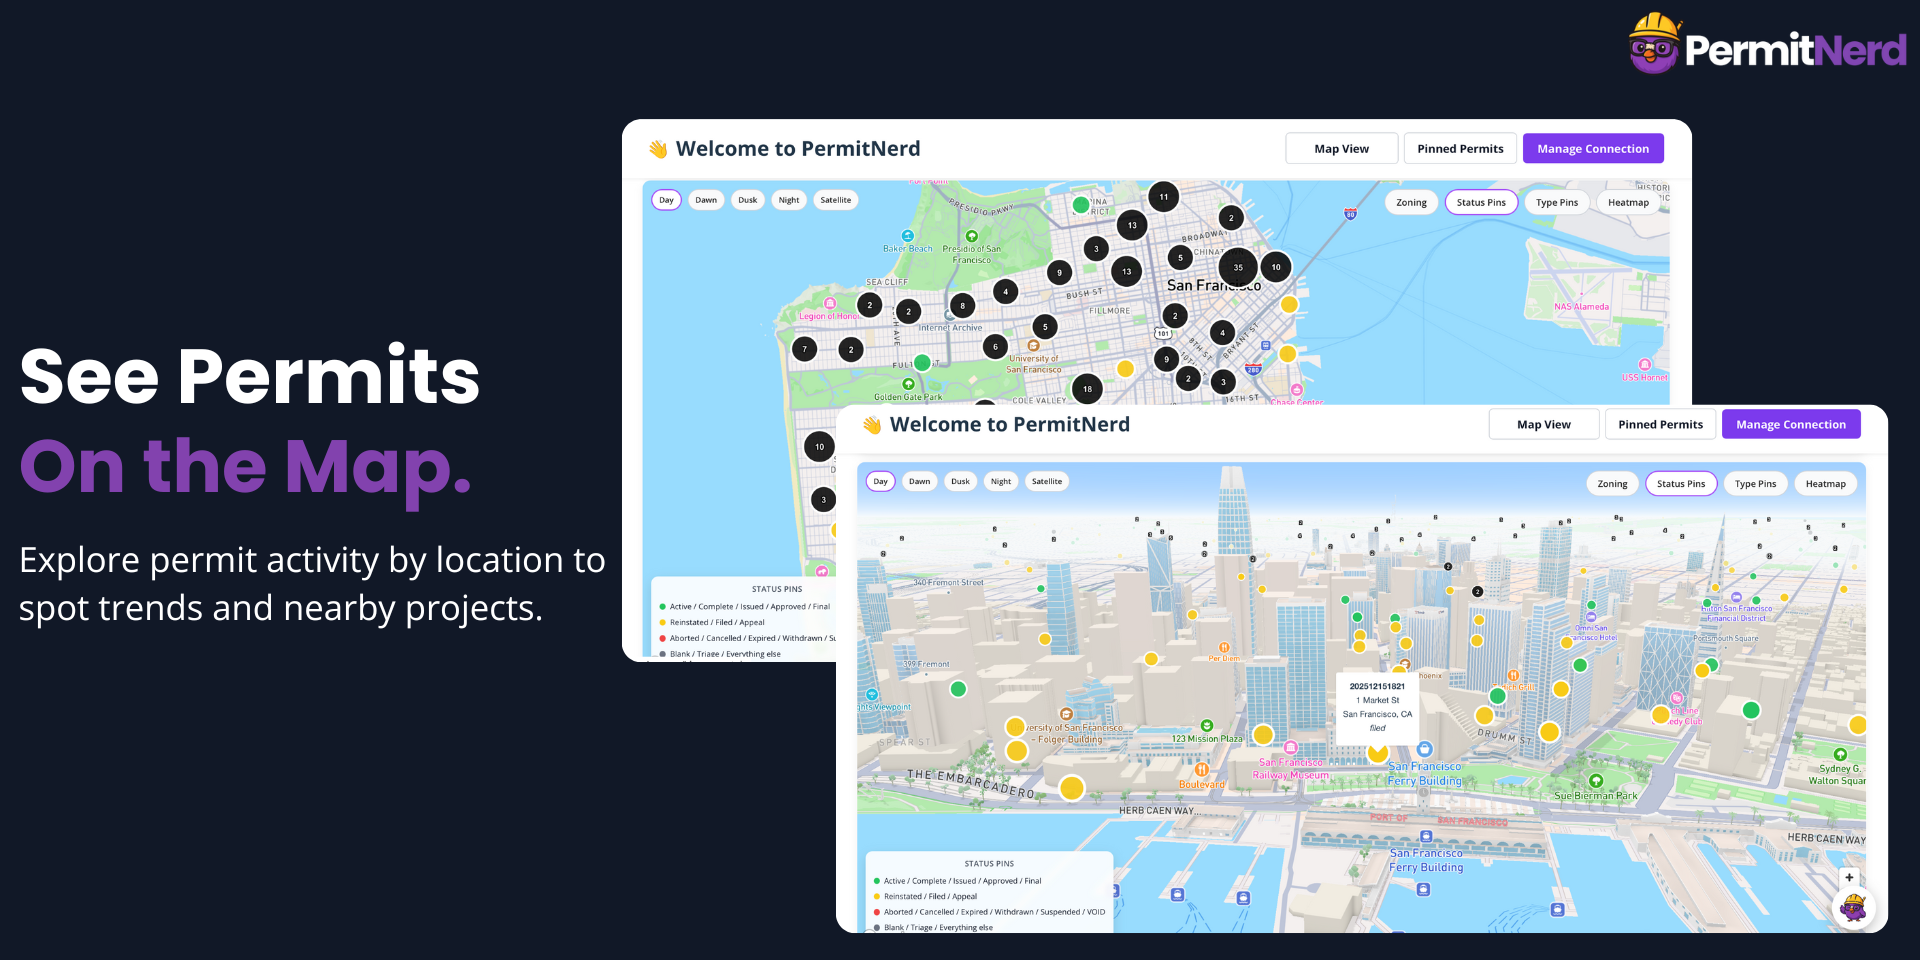
🗺️ Map View
• Visualize permits geographically
• Spot activity clusters and risk areas
⏱️ The Cost of Not Using PermitNerd
• Delayed starts and missed approvals
• Last-minute fire drills and lost revenue
🎯 Get Ahead of Permits Before They Block Your Projects
Install PermitNerd or book a demo to see it in action.
✅ Current Supported Cities
Austin • Chicago • San Francisco • Seattle • New York
🟨 Coming Soon
Phoenix • Miami • Washington DC • Atlanta
Security & Compliance
Security
Does the developer periodically perform penetration testing?
Not answered
Does the developer have a dedicated security and privacy point of contact for such issues or questions?
Not answered
Does the app restrict redirects and forwards only to approved destinations, or show a warning when redirecting to potentially untrusted content?
Yes
The app strictly restricts redirects and forwards to approved, predefined destinations only. All redirects are controlled server-side and limited to trusted domains owned and operated by PermitNerd or monday.com. The app does not allow user-supplied redirect URLs, dynamic forwarding, or redirection to external or untrusted content. This ensures users are never redirected to malicious or unintended destinations and aligns with monday.com security and compliance best practices.
Does the app protect against mass parameter assignment attacks?
Yes
The app explicitly whitelists and validates allowed request parameters on the server side. Only expected, predefined fields are processed, and any additional or unexpected parameters are ignored. This prevents mass parameter assignment and unauthorized modification of protected fields.
Does the app perform encoding and sanitization on all user supplied parameters to protect against Cross-Site Scripting?
Yes
All user-supplied input is validated and sanitized before processing or storage. The app does not render raw user input as executable code, and responses are served as structured JSON. Client-side rendering follows safe encoding practices to prevent Cross-Site Scripting (XSS).
Does the developer protect all state-changing actions against Cross-Site Request Forgery (CSRF)?
Yes
All state-changing actions are protected using authenticated requests and verified tokens. The app relies on monday.com session tokens, server-side authorization checks, and webhook signature verification to ensure requests originate from trusted sources and cannot be forged.
Does the developer have mechanisms to notify monday.com in case of a security breach?
Yes
The developer maintains incident response procedures and monitoring mechanisms. In the event of a security incident affecting monday.com users or data, monday.com would be notified promptly in accordance with platform requirements and responsible disclosure best practices.
Does this developer have a process for installing application-level updates and security patches for the service (such as software packages and databases)?
Not answered
Compliance
Is the app certified with the information security standard ISO/IEC 27001:2022?
Not answered
Is the app compliant with the Health Insurance Portability and Accountability Act (HIPAA)?
Not answered
Is the app certified with System and Organization Controls (SOC 2 or SOC 3)?
Not answered
Is the app compliant with the General Data Protection Regulation (GDPR)?
Not answered
Data
Does the app send any data outside of monday.com? If yes, indicate whether the data is customer-submitted (e.g., board names, item names, doc content) or non-customer-submitted (e.g., account ID, board ID, user ID).
Not answered
Where does the app store logs data?
other
Application logs are stored securely within the cloud hosting provider’s logging system (Render). Logs are used solely for operational monitoring and debugging.
Where does the app store the app data?
DB
Application data is stored in a managed PostgreSQL database. Data is encrypted at rest and access is restricted to server-side services.
Does the developer ensure application logs do not contain secrets or personally-identifiable information (PII)?
Yes
Logs are intentionally designed to exclude secrets, access tokens, and personally-identifiable information. Sensitive credentials are stored securely in environment variables and never written to logs.
Is customer data segregated from the data of other customers (for example logically or physically)?
Yes
Customer data is logically segregated by monday account ID. All queries are scoped per account, ensuring that customers can only access their own data.
Privacy
Does the developer enforce multi-factor authentication on employees access to systems which may process customer data?
Yes
Access to production systems and infrastructure is restricted to the developer and protected using provider-level security controls, including multi-factor authentication (MFA) enforced by hosting and tooling providers (e.g., GitHub, cloud hosting, and database services).
Does the developer protect access to customer data based on the principle of least privilege?
Yes
Access to customer data is limited to the minimum required for application functionality. Service-role credentials are used only on secure server-side routes, tokens are scoped per account, and no customer data is exposed to unauthorized users or clients.
Reviews
No reviews yet.
Historical data
Installation history
We have data for December 28, 2024 onwards only. Collected sometime after 00:00 UTC daily.
Total number of installs
Change in total number of installs in last 1 day(s)
Compares the number of installs on each date with 1 days previously:
Max
Min
Current
Change in total number of installs in last 7 day(s)
Compares the number of installs on each date with 7 days previously:
Max
Min
Current
Change in total number of installs in last 30 day(s)
Compares the number of installs on each date with 30 days previously:
Max
Min
Current
Change in total number of installs in last 90 day(s)
Compares the number of installs on each date with 90 days previously:
Max
Min
Current
Change in total number of installs in last 180 day(s)
Compares the number of installs on each date with 180 days previously:
Max
Min
Current
Ratings history
Categories history
Each of the following is a yes/no answer, so the graphs show 1 for yes, and 0 for no.
{
"id": 10001046,
"marketplace_developer_id": 100000150,
"app_id": 10460954,
"app_type": "app",
"security_info": {},
"gallery_assets": [
{
"url": "https://cdn.monday.com/marketplace/10001046/10001046_2026_1_3_11_59_39_iwg4qqs.png",
"type": "image"
},
{
"url": "https://cdn.monday.com/marketplace/10001046/10001046_2026_1_3_11_59_47_aldhco3g.png",
"type": "image"
},
{
"url": "https://cdn.monday.com/marketplace/10001046/10001046_2026_1_3_11_59_52_dnlp53k.png",
"type": "image"
},
{
"url": "https://cdn.monday.com/marketplace/10001046/10001046_2026_1_3_12_0_0_ir8ezgx.png",
"type": "image"
},
{
"url": "https://cdn.monday.com/marketplace/10001046/10001046_2026_1_3_12_0_6_u46z99e.png",
"type": "image"
},
{
"url": "https://cdn.monday.com/marketplace/10001046/10001046_2026_1_3_12_0_34_7r6jnqd.mp4",
"type": "video"
}
],
"description": "<p>🚨 <strong>Stop Guessing on Permits. Start Controlling Them.</strong></p><p>PermitNerd is an AI-powered construction permit management app for teams tired of delays, surprises, and chasing permit status across disconnected city systems.</p><p>If permits slow your projects down, this app was built for you.</p><p><br></p><p>Most teams react to permit problems.</p><p>PermitNerd helps you see them coming—directly inside <a href=\"http://monday.com/\" rel=\"noopener noreferrer\" target=\"_blank\">monday.com</a>.</p><p>🏗️ <strong>Why PermitNerd Exists</strong></p><p>• Approval timelines are unpredictable</p><p>• One missed permit can stall an entire project</p><p>PermitNerd turns permits into structured, searchable, and actionable intelligence—so you stay ahead instead of playing catch-up.</p><p>🔍 <strong>Search Real Permit Data</strong></p><p>• Search live permit data across supported cities</p><p>• Filter by city, status, type, and key dates</p><p>📌 <strong>Pin Permits to monday Boards</strong></p><p>• Attach permits to projects in seconds</p><p>• Keep teams aligned without spreadsheets or guesswork</p><p>📊 <strong>Permit Intelligence Dashboards</strong></p><p>• View average approval timelines by city</p><p>• Identify jurisdictions that slow projects down</p><p>🤖 <strong>AI Permit Assistant (Percy)</strong></p><p>• Ask why a permit is delayed or pending</p><p>• Understand what to expect next</p><p>🗺️ <strong>Map View</strong></p><p>• Visualize permits geographically</p><p>• Spot activity clusters and risk areas</p><p>⏱️ <strong>The Cost of Not Using PermitNerd</strong></p><p>• Delayed starts and missed approvals</p><p>• Last-minute fire drills and lost revenue</p><p>🎯 <strong>Get Ahead of Permits Before They Block Your Projects</strong></p><p>Install PermitNerd or book a demo to see it in action.</p><p>✅ <strong>Current Supported Cities</strong></p><p>Austin • Chicago • San Francisco • Seattle • New York</p><p>🟨 <strong>Coming Soon</strong></p><p>Phoenix • Miami • Washington DC • Atlanta</p>",
"short_description": "Real-time building permit tracking inside monday.com",
"thumbnail_url": "https://cdn.monday.com/marketplace/10001046/10001046_2026_1_3_11_59_7_vxzebbni.png",
"logo_url": "https://cdn.monday.com/marketplace/10001046/10001046_2026_1_3_11_58_51_f6a3eg3.png",
"feedback_url": "Hello@PermitNerd.com",
"privacy_policy_url": "https://www.permitnerd.com/app-privacy-policy",
"featured": false,
"name": "PermitNerd",
"how_to_use_url": "https://www.permitnerd.com/appsupport",
"external_pricing_url": null,
"keywords": "Building Permits,Permits,Permit Tracking,Project compliance,Construction,Permit Monitoring,Construction Workflows,Permit Management,Real Estate Development",
"compliance_answers": [
{
"questionId": 18,
"logHostingProvider": "other",
"detailedAnswer": "Application logs are stored securely within the cloud hosting provider’s logging system (Render). Logs are used solely for operational monitoring and debugging."
},
{
"questionId": 17,
"dataHostingProvider": "DB",
"detailedAnswer": "Application data is stored in a managed PostgreSQL database. Data is encrypted at rest and access is restricted to server-side services."
},
{
"questionId": 10,
"shortAnswer": true,
"detailedAnswer": "The app strictly restricts redirects and forwards to approved, predefined destinations only.\n\nAll redirects are controlled server-side and limited to trusted domains owned and operated by PermitNerd or monday.com. The app does not allow user-supplied redirect URLs, dynamic forwarding, or redirection to external or untrusted content.\n\nThis ensures users are never redirected to malicious or unintended destinations and aligns with monday.com security and compliance best practices."
},
{
"questionId": 9,
"shortAnswer": true,
"detailedAnswer": "The app explicitly whitelists and validates allowed request parameters on the server side. Only expected, predefined fields are processed, and any additional or unexpected parameters are ignored. This prevents mass parameter assignment and unauthorized modification of protected fields."
},
{
"questionId": 8,
"shortAnswer": true,
"detailedAnswer": "Logs are intentionally designed to exclude secrets, access tokens, and personally-identifiable information. Sensitive credentials are stored securely in environment variables and never written to logs."
},
{
"questionId": 7,
"shortAnswer": true,
"detailedAnswer": "Access to production systems and infrastructure is restricted to the developer and protected using provider-level security controls, including multi-factor authentication (MFA) enforced by hosting and tooling providers (e.g., GitHub, cloud hosting, and database services)."
},
{
"questionId": 6,
"shortAnswer": true,
"detailedAnswer": "Access to customer data is limited to the minimum required for application functionality. Service-role credentials are used only on secure server-side routes, tokens are scoped per account, and no customer data is exposed to unauthorized users or clients."
},
{
"questionId": 5,
"shortAnswer": true,
"detailedAnswer": "All user-supplied input is validated and sanitized before processing or storage. The app does not render raw user input as executable code, and responses are served as structured JSON. Client-side rendering follows safe encoding practices to prevent Cross-Site Scripting (XSS)."
},
{
"questionId": 4,
"shortAnswer": true,
"detailedAnswer": "All state-changing actions are protected using authenticated requests and verified tokens. The app relies on monday.com session tokens, server-side authorization checks, and webhook signature verification to ensure requests originate from trusted sources and cannot be forged."
},
{
"questionId": 3,
"shortAnswer": true,
"detailedAnswer": "The developer maintains incident response procedures and monitoring mechanisms. In the event of a security incident affecting monday.com users or data, monday.com would be notified promptly in accordance with platform requirements and responsible disclosure best practices."
},
{
"questionId": 1,
"shortAnswer": true,
"detailedAnswer": "Customer data is logically segregated by monday account ID. All queries are scoped per account, ensuring that customers can only access their own data."
}
],
"created_at": "2026-02-03T11:58:35.916Z",
"updated_at": "2026-02-09T16:16:17.901Z",
"automation_app_id": null,
"marketplace_category_ids": [
10000001,
9,
6
],
"pinned_for_categories_ids": [],
"featured_for_categories_ids": [],
"pricing_data": "Free plan available",
"label": null,
"app_values": [
"Everyday tasks"
],
"security": false,
"display_in_template_store": false,
"acquisition_source": "No touch",
"is_connector": false,
"terms_of_service_url": "https://www.permitnerd.com/app-terms-conditions",
"available_for_tiers": [],
"available_for_products": [],
"google_analytics_tag_id": null,
"is_solution": false,
"app_scope_str": "boards:read,users:read,me:read,boards:write,workspaces:read,notifications:write,webhooks:read,webhooks:write",
"app_client_id": "89fd267811fab8e458ac0a7e2039ef2b",
"app_color": {
"hsl": {
"h": 272.7659574468085,
"s": 0.6746411483253589,
"l": 0.5901960784313726,
"a": 1
},
"hex": "#9d50dd",
"rgb": {
"r": 157,
"g": 80,
"b": 221,
"a": 1
},
"hsv": {
"h": 272.7659574468085,
"s": 0.6380090497737557,
"v": 0.8666666666666667,
"a": 1
},
"oldHue": 260.14925373134326,
"source": "hex"
},
"plans": [
{
"id": "10460954-1-free",
"appPlanId": "free",
"name": "Free",
"versionId": 1,
"isTrial": false,
"prices": {
"type": "standard",
"monthly": 0,
"yearly": 0
},
"versionState": "live",
"appId": 10460954,
"description": "Basic access to search permits with limited usage.",
"extraData": {
"bullets": [
"• Up to 1 board",
"• Up to 2 pinned permits",
"• Unlimited permit searches",
"• Unlimited users across your organization"
],
"monthlyFee": 0,
"yearlyFee": 0
},
"isFree": true,
"isRecommended": false,
"currency": "USD"
},
{
"id": "10460954-1-starter",
"appPlanId": "starter",
"name": "Starter",
"versionId": 1,
"isTrial": false,
"prices": {
"type": "standard",
"monthly": 30,
"yearly": 27
},
"versionState": "live",
"appId": 10460954,
"description": "For small teams tracking permits.",
"extraData": {
"bullets": [
"• Everything in free",
"• Up to 3 boards",
"• Up to 50 pinned permits",
"• Permit Summary Dashboard ",
"• Permit expiry notifications"
],
"monthlyFee": 30,
"yearlyFee": 27
},
"isFree": false,
"isRecommended": false,
"currency": "USD"
},
{
"id": "10460954-1-pro",
"appPlanId": "pro",
"name": "Pro",
"versionId": 1,
"isTrial": false,
"prices": {
"type": "standard",
"monthly": 60,
"yearly": 54
},
"versionState": "live",
"appId": 10460954,
"description": "For growing teams who want visibility, maps, and smarter tracking.",
"extraData": {
"bullets": [
"• Everything in Starter",
"• Up to 10 boards",
"• Up to 500 pinned permits",
"• Expanded Permit Summary Dashboard ",
"• Detailed Map View"
],
"monthlyFee": 60,
"yearlyFee": 54
},
"isFree": false,
"isRecommended": false,
"currency": "USD"
},
{
"id": "10460954-1-advanced",
"appPlanId": "advanced",
"name": "Advanced",
"versionId": 1,
"isTrial": false,
"prices": {
"type": "standard",
"monthly": 100,
"yearly": 90
},
"versionState": "live",
"appId": 10460954,
"description": "For organizations that want proactive insights and AI-powered support.",
"extraData": {
"bullets": [
"• Everything in Pro",
"• Up to 25 boards",
"• Up to 1000 pinned permits",
"• AI Project Assistant"
],
"monthlyFee": 100,
"yearlyFee": 90
},
"isFree": false,
"isRecommended": false,
"currency": "USD"
}
],
"app_live_version": {
"updated_at": "2026-01-28T21:09:51.998Z",
"id": 12532554
},
"pricing_model": null,
"badges_data": {
"pricing_data": "Free plan available",
"app_values": [
"Everyday tasks"
],
"security": false,
"acquisition_source": "No touch",
"display_in_template_store": false
},
"data": {
"is_connector": false,
"google_analytics_tag_id": null,
"is_solution": false,
"terms_of_service_url": "https://www.permitnerd.com/app-terms-conditions",
"available_for_tiers": [],
"available_for_products": []
},
"display": null,
"installsDelta": {
"totalInstalls": 5,
"sevenDays": 0,
"thirtyDays": 1
}
}