Convert addresses & coordinates seamlessly in your boards
Make your monday.com boards smarter with location data
GeoBuddy supercharges your monday.com experience by turning raw address and coordinate data into structured, actionable insights. Whether you’re in logistics, real estate, field services, or project management, GeoBuddy helps you work faster, cleaner, and smarter with location-based information.
🚀Key Features
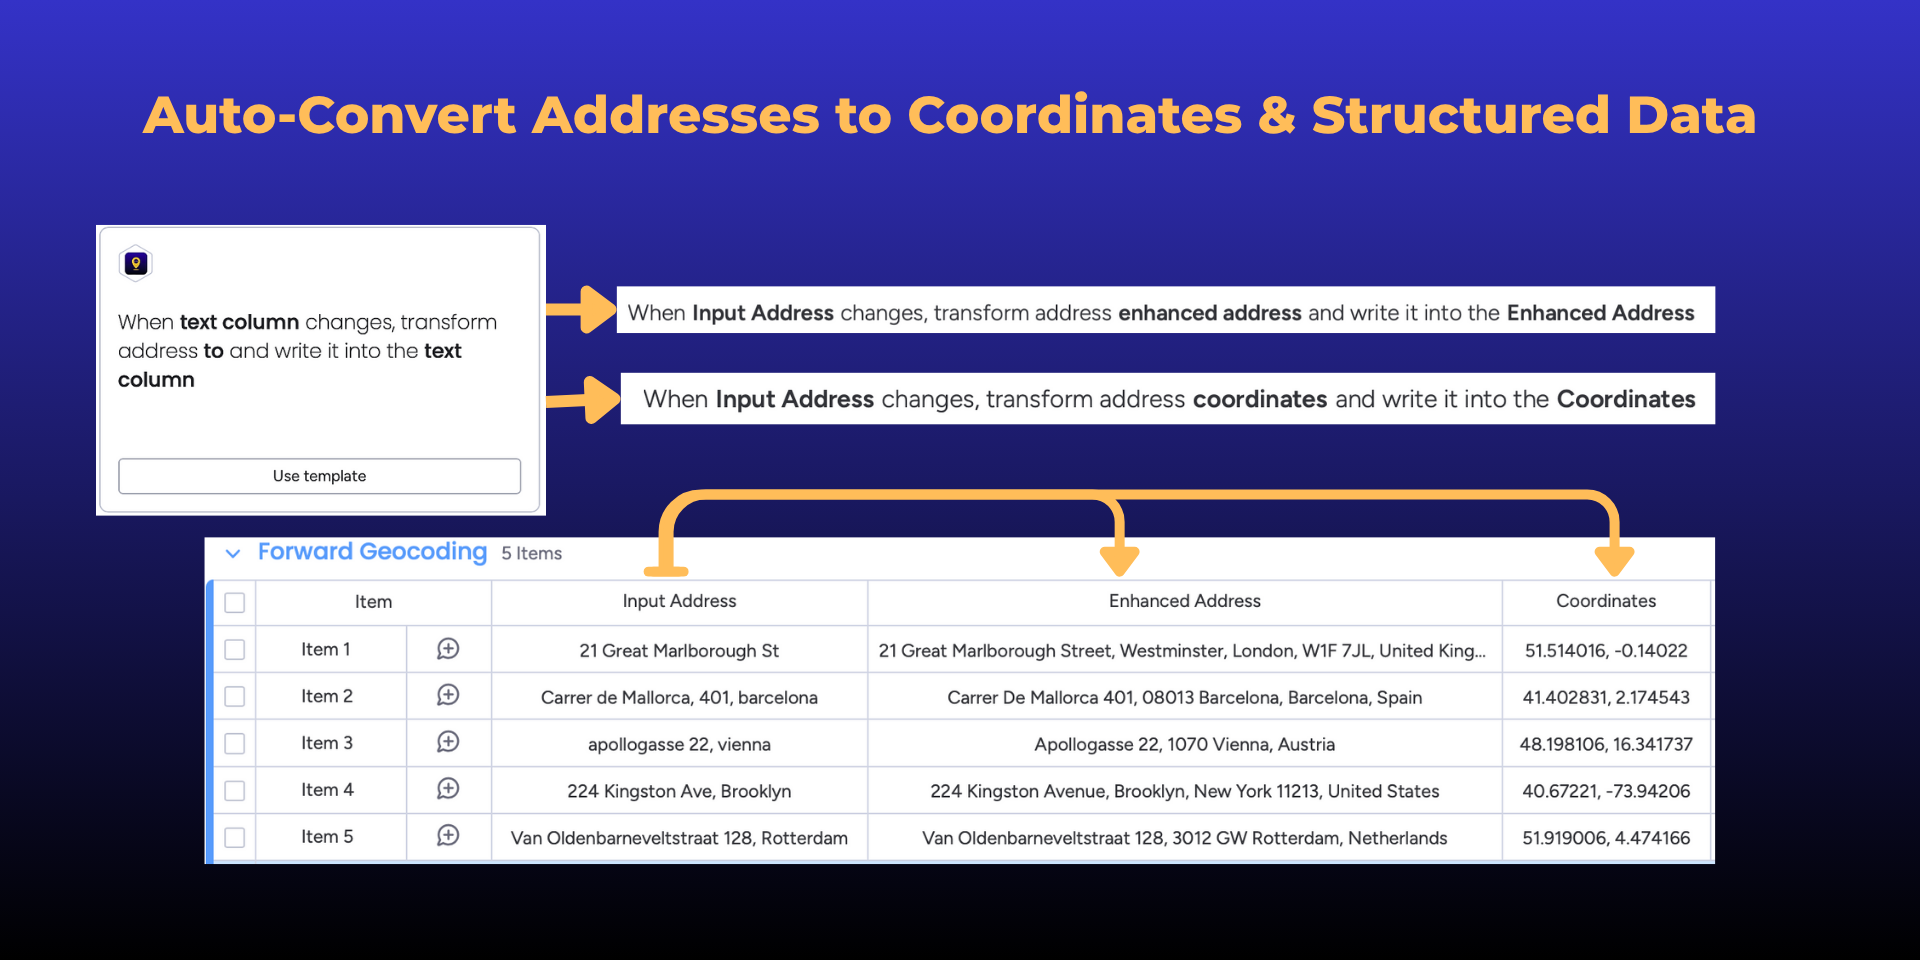
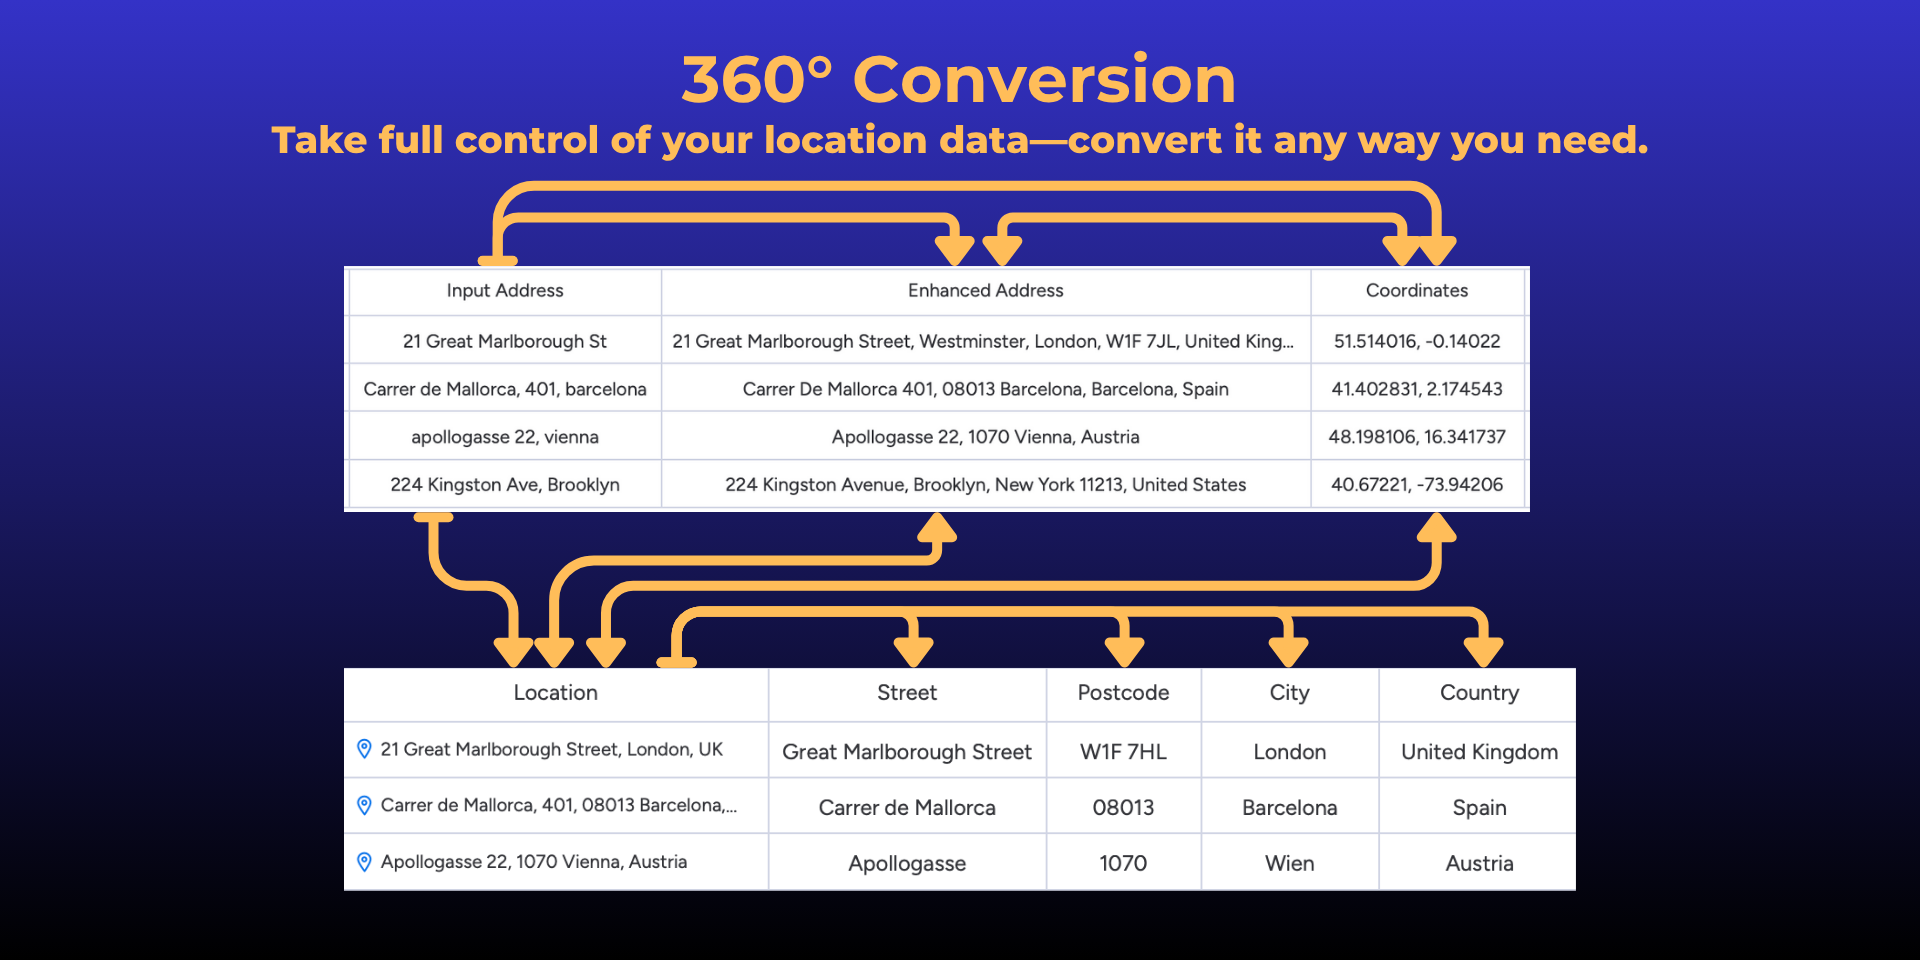
📍 Address Enhancement
Automatically fix and enrich raw address inputs for better accuracy and consistency.
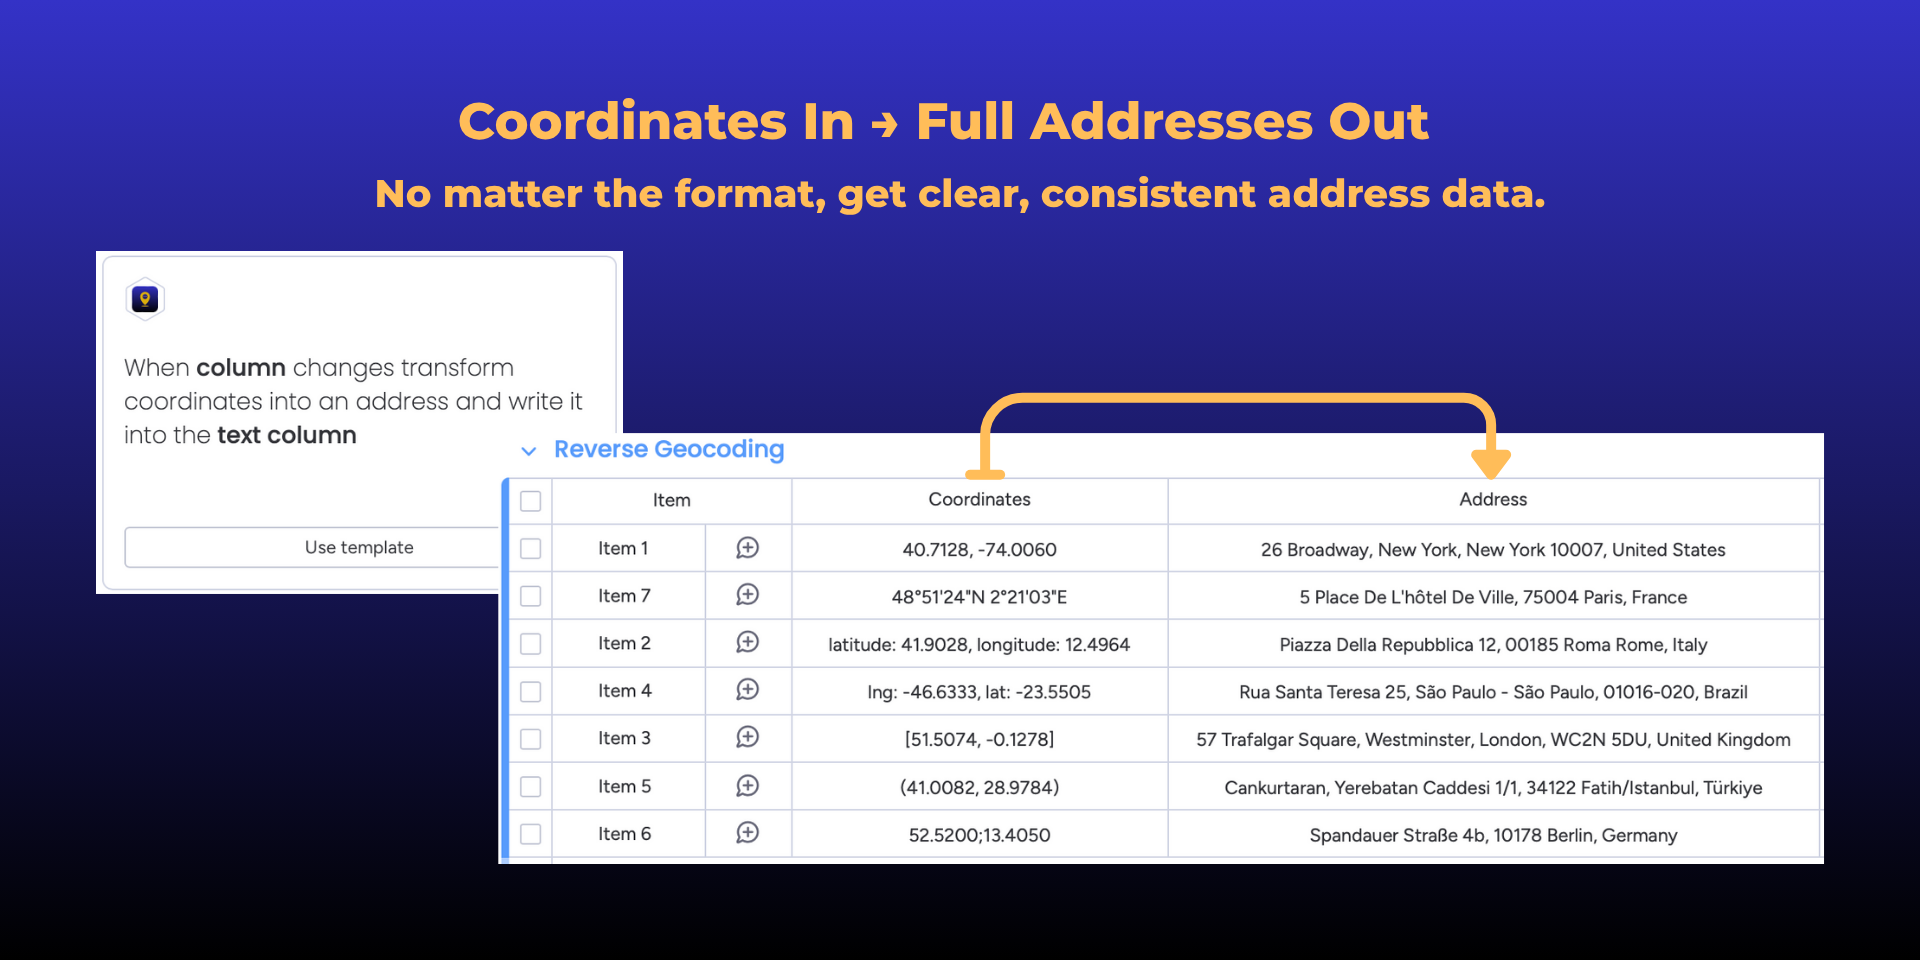
🔁 Address ↔ Coordinates Conversion
Convert between street addresses and latitude/longitude in both directions instantly.
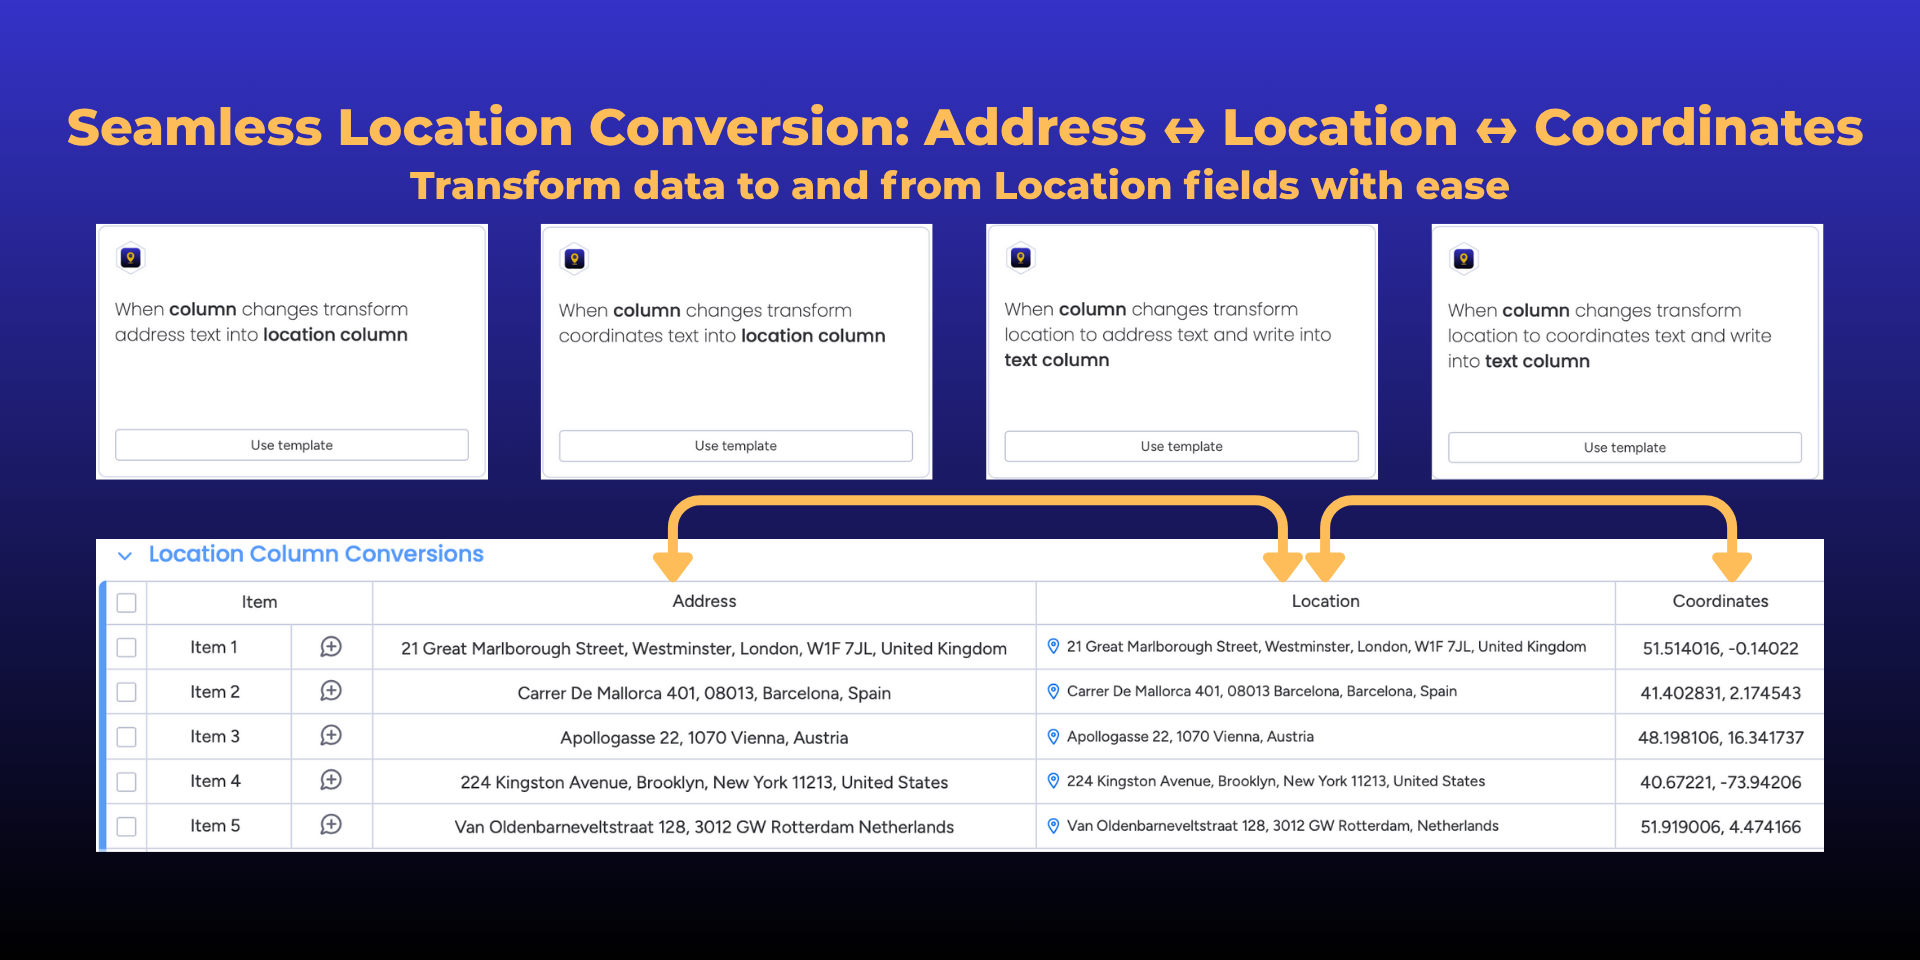
📤 Text to Location Column Conversion
Parse address or coordinate strings directly into monday.com’s Location Column format.
📥 Extract from Location Columns
Pull full address or coordinates from your existing Location fields.
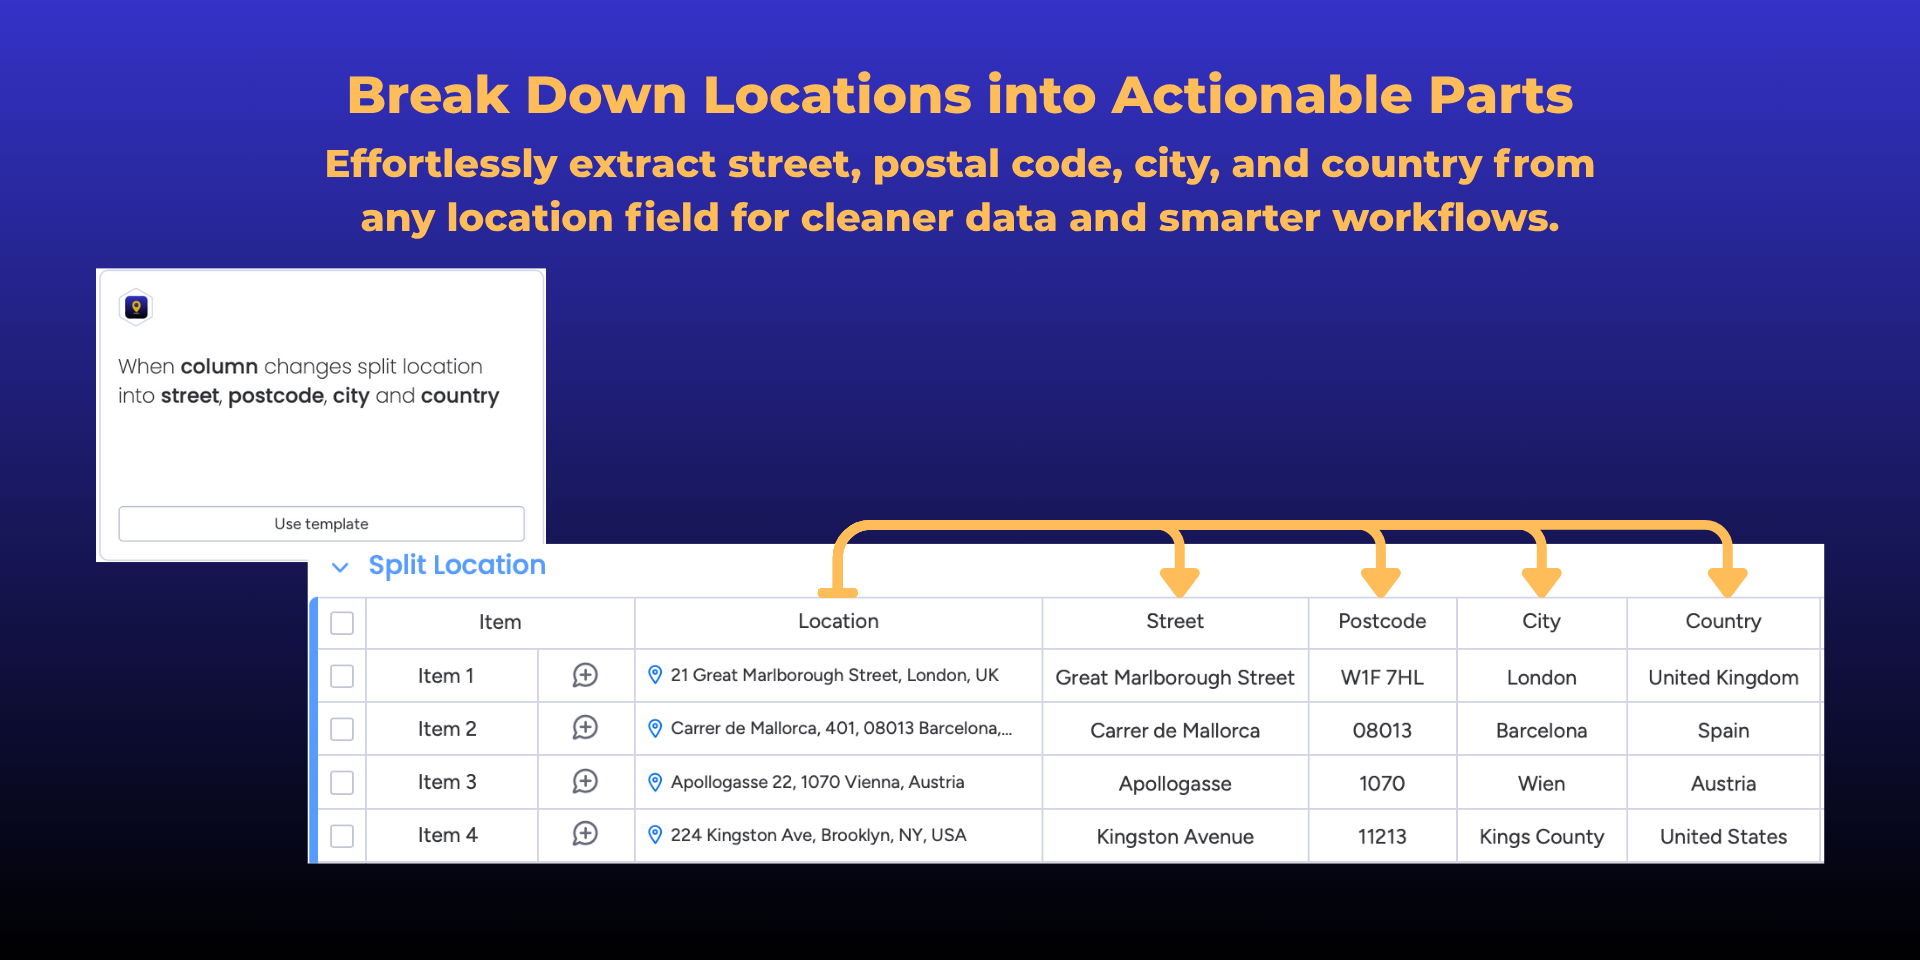
🧩 Split Location Data
Automatically split Location Columns into structured fields: House Number,Street, City, Country, and Postal Code
🗺️ Distance & Travel Time Calculation (NEW)
Calculate the distance and estimated travel time between two points using your preferred travel mode: driving, driving-traffic, cycling, or walking.
✅Why Teams Choose GeoBuddy
Saves hours every week by automating geocoding workflows
Delivers clean, structured location information across your boards
Eliminates manual copy-pasting and data inconsistencies
Integrates seamlessly without disrupting existing boards
👉 Book a Demo to see GeoBuddy in action and explore how it fits your team’s workflow.
Security & Compliance
The app developer did not provide the security and compliance information for this app.
Reviews
November 28, 2025
IW: Tut zuverlässig was es soll. Erstklassiger Support vom Entwicklerteam. Kann ich nur weiterempfehlen
Developer response:
Vielen Dank für das tolle Feedback! Wir freuen uns, dass alles zuverlässig funktioniert und wir Sie unterstützen konnten.
Historical data
Installation history
We have data for December 28, 2024 onwards only. Collected sometime after 00:00 UTC daily.
Total number of installs
Change in total number of installs in last 1 day(s)
Compares the number of installs on each date with 1 days previously:
Max
Min
Current
Change in total number of installs in last 7 day(s)
Compares the number of installs on each date with 7 days previously:
Max
Min
Current
Change in total number of installs in last 30 day(s)
Compares the number of installs on each date with 30 days previously:
Max
Min
Current
Change in total number of installs in last 90 day(s)
Compares the number of installs on each date with 90 days previously:
Max
Min
Current
Change in total number of installs in last 180 day(s)
Compares the number of installs on each date with 180 days previously:
Max
Min
Current
Ratings history
Categories history
Each of the following is a yes/no answer, so the graphs show 1 for yes, and 0 for no.